Flag and Pennant Patterns are consolidation patterns that occur after a sharp advance or decline. Since it is a continuation pattern, the preceding trend continues after the Pattern is broken in the direction of the trend.
The first move of a Flag or Pennant Pattern happens on a sharp advance or decline and often happens on heavy volume indicating a strong uptrend or downtrend.
The flagpole of the Flag or Pennant Pattern is usually the distance from the support or resistance from where the sharp advance or decline started to the high or low of the Flag or Pennant.
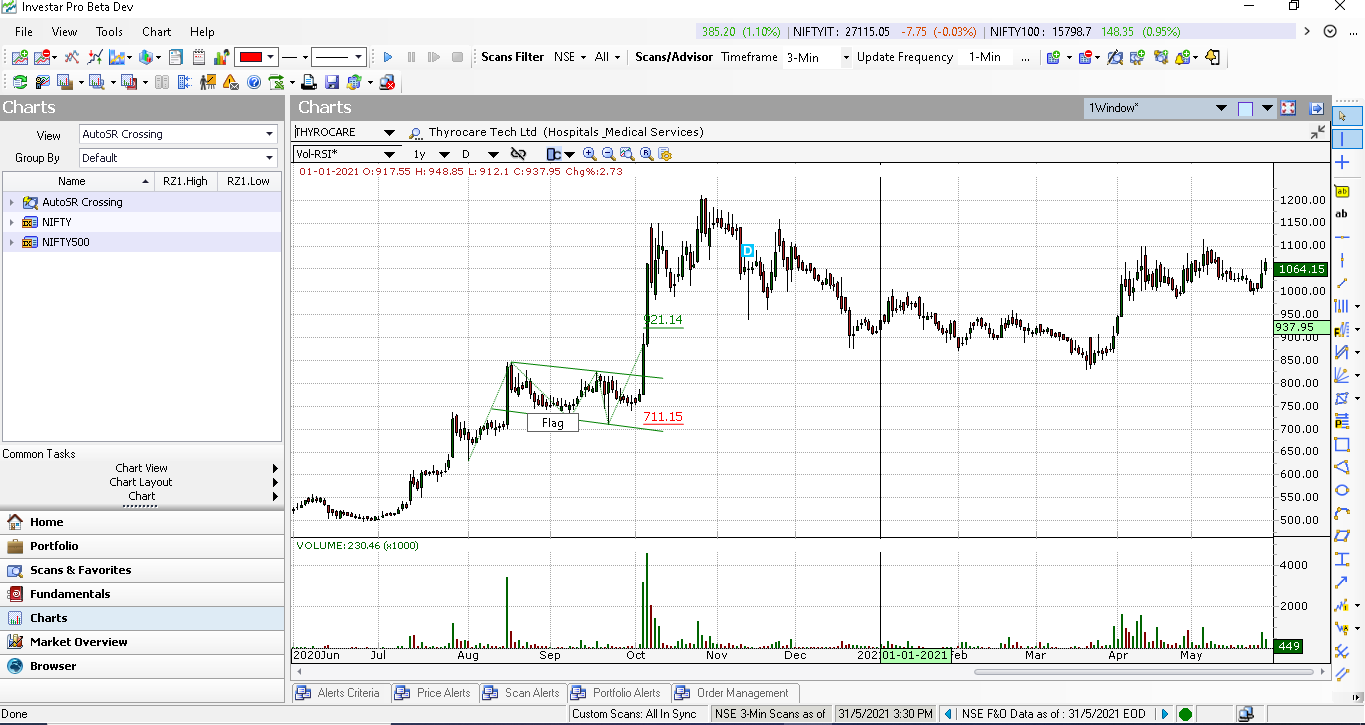
Bullish Flag Pattern
The Bullish Flag Pattern forms after the break of a resistance, and consolidates downwards in the opposite direction to the original move in a small rectangle formation (i.e. two small parallel trendlines sloping downward which constitute the Flag). The break of resistance (i.e. upper trendline) of the Bullish Flag Pattern indicates that the original upward move will continue further after the breakout. An example of a Bullish Flag Pattern is shown below using the Auto-Classical Pattern feature of Investar.
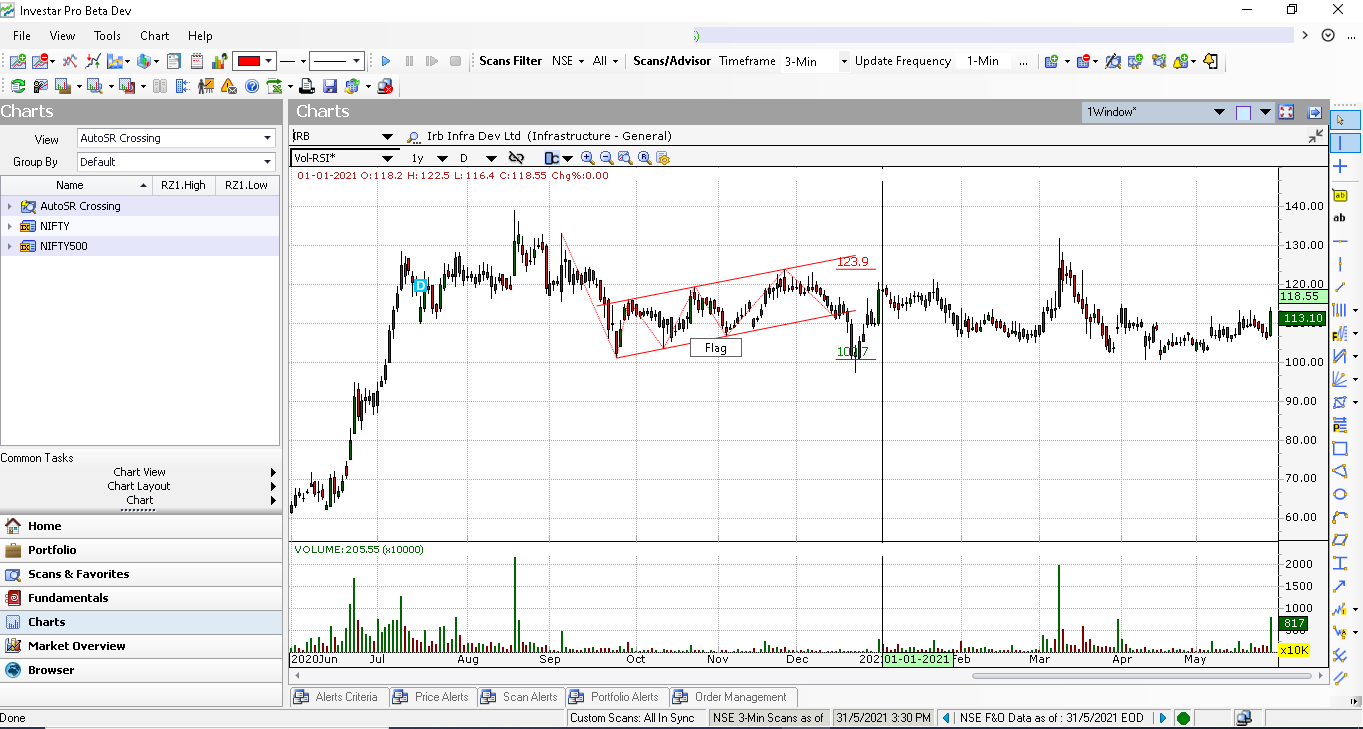
Bearish Flag Pattern
The Bearish Flag Pattern forms after the break of support, and consolidates upwards in a small rectangle formation. (i.e. two small parallel trendlines sloping upward that constitute the Flag). The break of support (i.e. lower trendline) of the Bearish Flag Pattern indicates that the original downward move will continue further after the breakout. An example of a Bearish Flag Pattern is shown below using the Auto-Classical Pattern feature of Investar.
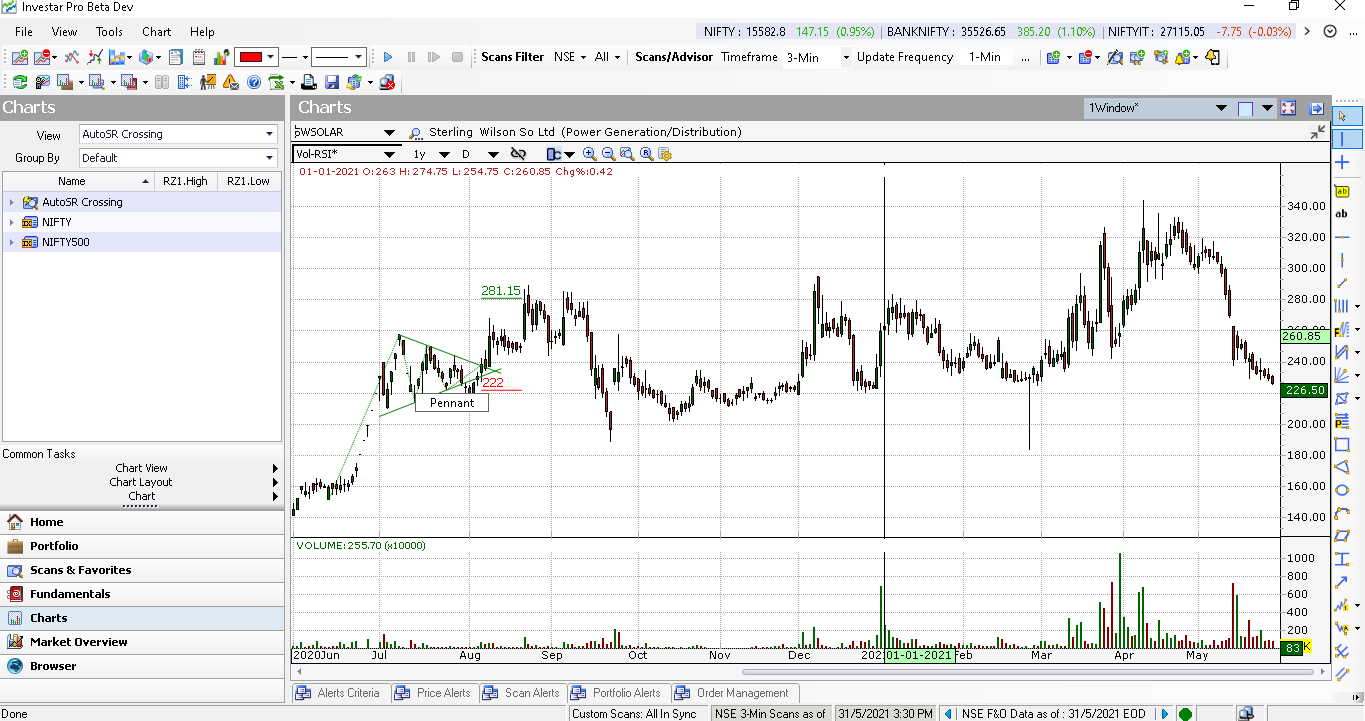
Bullish and Bearish Pennant Pattern
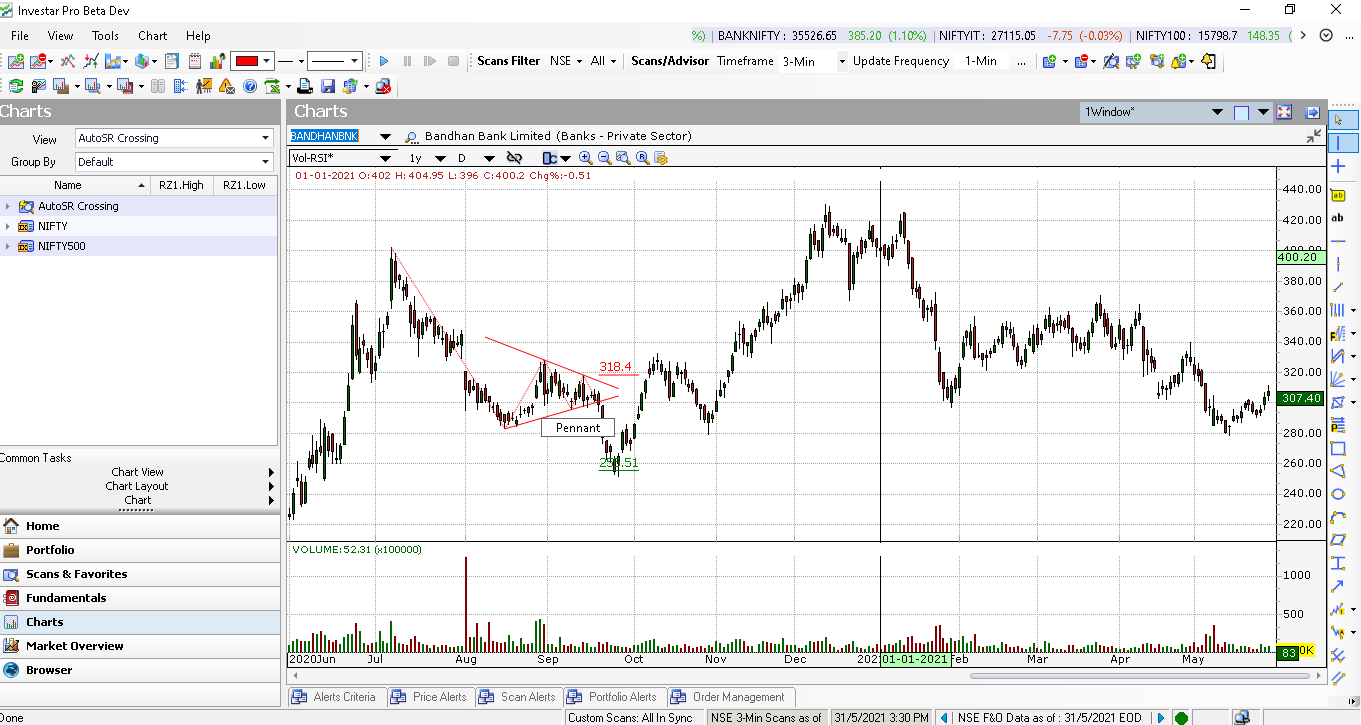
The only difference between the Flag and Pennant is that in case of a Pennant, instead of the rectangle formation, we have a symmetrical triangle formation which slopes in the opposite direction to the original move. Hence a Bullish Pennant Pattern would slope downward while a Bearish Pennant Pattern would slope upwards. An example of a Bullish and Bearish Pennant Pattern is shown below using the Auto-Classical Pattern feature of Investar.
Bullish Pennant Pattern:
Bearish Pennant Pattern:
The duration of the Flag or Pennant pattern will ideally be 1 to 4 weeks . The volume is usually very high during the Flagpole and should be low during the consolidation. When the breakout/breakdown of the Flag or Pennant occurs on high volume, it is again a strong signal indicating that the movement in the direction of the original trend will continue.
The target after the Flag or Pennant is broken can be the distance of the Flag Pole.
For more details, check out our video on “Auto-Classical Patterns” for an in-depth look into this topic :