Today, we’ll learn about inverted yield curve, and how it predicts recession. There is no any foolproof formula as such that helps to predict the future path of the economy or recessions in particular. However, one can safely state that one indicator does predict the recession more or less accurately, and that is the inverted yield curve.
Introduction
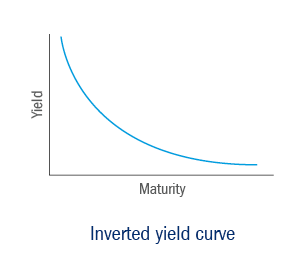
A yield curve is formed when a chart showing interest rates and maturity term (1 year or 10 years) slopes upward. It indicates long-term maturities pay higher interest rates which is a norm. However, in exceptional scenarios, short-term maturities pay higher interest rates. And as a result, market sentiment suggests that the long-term outlook is worsening and that the yields offered by long-term fixed income will continue to tumble. So, when the curve slopes downward, it is called an inverted yield curve which means that short-term interest rates exceed long-term rates. An inverted yield curve is rare but is strongly suggestive of a severe economic slowdown.
Here, we must note that the yield curve does not cause recessions. The reason behind inversion of the yield curve is that the US Federal Reserve tightens the interest rates. It means short-term interest rates go up. This is because the long-term interest rates are not so sensitive to the Fed measures and thus go up comparatively less as against short-term rates. Long-term rates also respond in anticipation of inflation, with Fed’s tightening measures reducing prospective future inflation, which eventually slash the interest rates of long-term maturities. That’s when the curve formed, is called an inverted yield curve, and it more often forecasts an impending recession. Thus, the yield curve acts as a signal of the recession but is not a cause.
What does an inverted yield curve really indicate?
When the yield curve is inverted, it indicates a cautious sentiment among investors that there is greater risk to the economy in the short run, which may lead into the central banks to eventually lowering interest rates to combat recession. In some cases, an inversion can be a helpful signal that a recession is on its way.
An inverted yield curve indicates the unusual drop of yields on longer-term debt below the yields on short-term debt of the same credit-quality. Sometimes referred to as a negative yield curve, the inverted curve has proven in the past to be a relatively reliable lead indicator of a recession.
How the market reacts to the current scenario?
In the month of March, the yield-curve in the US inverted. Normally, interest rates increase as maturity periods of the US Treasury bonds lengthens. However, if short-term rates rise above long-term rates, then it indicates the curve has inverted and can signal a future recession. To such a scenario, the market doesn’t wait and often prices in a recession even before it actually occurs, so we see that the stock market and the economy don’t track each other in perfect synchronisation. It is observed that the stock market often factors in recession as a leading indicator. Just the news of a possibility of higher economic recession acts as a dampener and it leads into sectorial indices falling considerably in recent months, as the Fed raises rates to tame inflation. No doubt the investors are not too keen to take a flier in such tampered sentiments.
Two other metrices have historically been important for yield curve inversion. First is the 3-month yield relative to the 10-year yield. Secondly, the depth of inverted curve matters too.
This time around, so far, the inversion has been pretty shallow. That may be considered a positive sign to count on.