Understanding the trend is the most important aspect for a trader to make money in financial markets. While using tools of technical analysis like candlestick patterns and indicators, a prior knowledge of the basic trend of the market is vital to improve odds of success in trading. Let’s get started and first understand what is a trend.
What is Trend?
A trend is defined in Technical Analysis as the direction of the market and can be of three types: uptrend, downtrend and sideways trend. If the direction of the market is upward, the market is said to be in an uptrend; if it is downward, it is in a downtrend and if you can classify it neither upward nor downward or rather fluctuating between two levels, then the market is said to be in a sideways trend.
Why is Trend important?
It is important to identify and understand trends so that you can trade with rather than against them. Always remember “Trend is your Friend”. Trading in the direction of the Trend maximizes your chance of success.
Traders can identify the trend using various forms of technical analysis, including both trendlines and technical indicators. However, using a trendline is the strongest form of confirming that a trend exists. Knowing the trend also helps to avoid false buy/sell signals (or whipsaws), as some indicators like oscillators behave better in sideways trends and others like trending indicators behave better in trending markets. Hence, it can lead to a much better success rate!
Identifying Trends
A trend is a general direction that a certain financial market is taking. Trend analysis is a section of technical analysis that explains trends and helps traders define direction.
The most common way to identify trends is using trendlines, which connect a series of highs or lows.
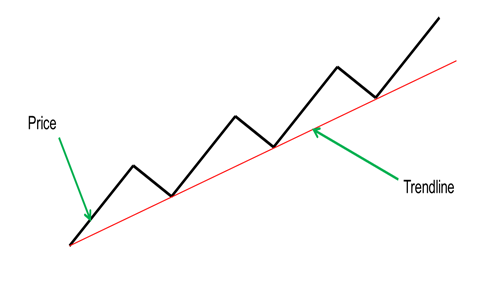
Uptrend: If you can connect a series of chart low points sloping upward, you have an uptrend. An uptrend is always characterized by higher highs and higher lows.
Downtrend: If you can connect a series of chart high points sloping downward, you have a downtrend. A downtrend is always characterized by lower highs and lower lows.
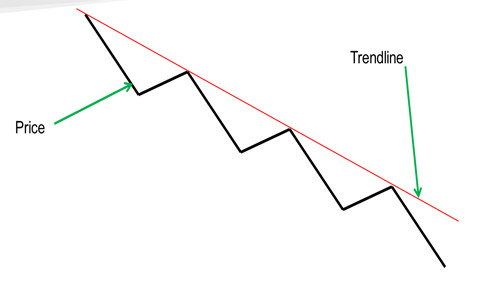
Although the above figures show line charts for simplicity, trendlines are usually drawn on candlestick charts. The very first thing to know about drawing trend lines is that you need at least two points in the market to start a trend line. Once the second swing high or low has been identified, you can draw your trend line.
Most trend lines you come across will have some overlap from the high or low of a candle, but what’s important is getting the most touches possible without cutting through the body of a candle (called a violation).
How is Trend used?
A break of the trendline usually signals a trend reversal. Hence, we can say that when an uptrend line is broken (i.e. stock closes below the uptrend line), the prior uptrend has ended (can also be used as a Sell signal depending on the strength of the trendline) and vice versa when a downtrend is broken (i.e stock closes above the downtrend line), it means that the prior downtrend has ended (can also be used as a Buy signal depending on the strength of the trendline).
One popular trading strategy is waiting for the price to touch the trendline and trade it. So, let’s say we are in an uptrend. Once the price makes a higher low and touches the lower trendline, traders will be buying. The same happens in a downtrend. Once the price makes a lower high, traders will be trading the trend line and selling. Traders trading the range are buying when price touches support and selling when it touches resistance.
A trendline can help estimate the future price trajectory, and also warn you when a trend may be reversing. Remember that trends occur on multiple time-frames. For example, the price may be moving in an overall downtrend on the daily chart, but an uptrend on the 15-minute chart. By looking at both longer-term and shorter-term trends, you can gain greater insight into the likely future price movements of the asset.
Drawing a trendline can be a cumbersome process, and can need years of experience to get it right, so to make things more easier for our traders we have introduced a new feature called Auto Trendline powered by AI), which not only does it automatically, but also colors the trend lines based on strength (blue for strong, red for not so strong).
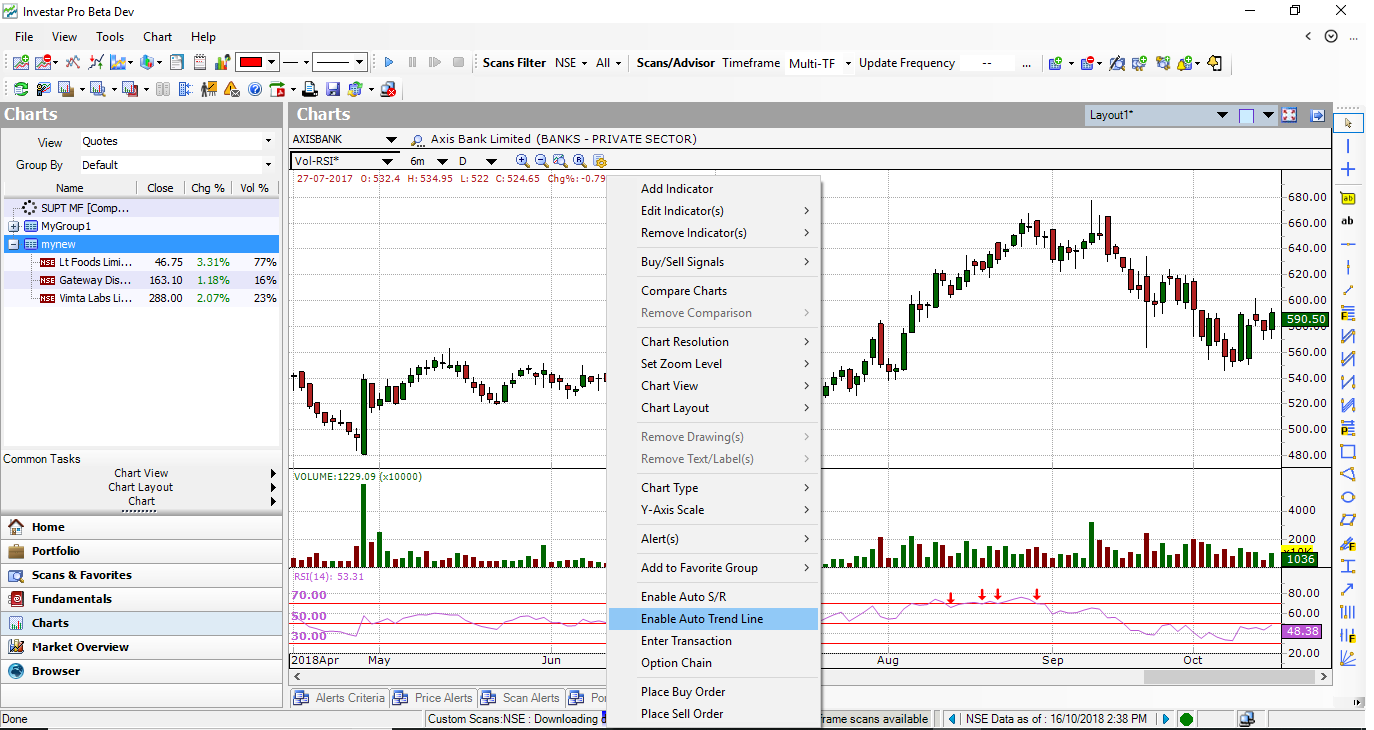
To enable Auto Trendline:
Simply Right click on the Chart and click Enable Auto Trend Line as shown below.
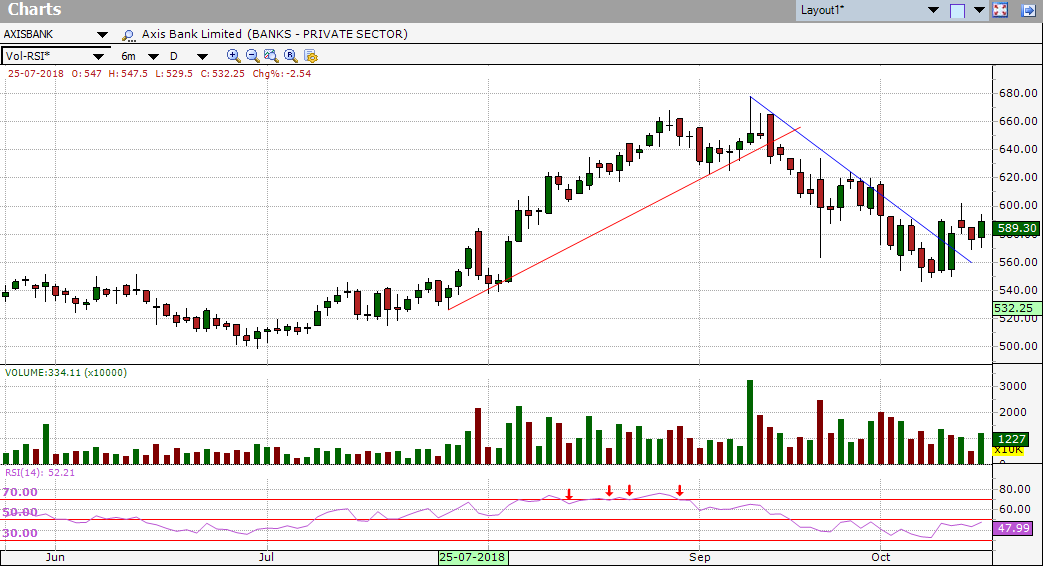
and you can see the trendlines on your selected chart.
Check out our video on “How to identify Trend and why it is important for profitable Trading” for an in-depth look into this topic :
In Hindi
In English
A strength of a Trendline
One challenge that is faced by a Technical Analyst is that if you have two trends co-existing nearby, how do you decide which one to use in your decision-making. In order to do that, we need to determine the strength of a trendline. This is done visually by an experienced Technical Analyst. But, when using the Auto Trendline feature, the lines are colored automatically to give you an idea of strength primarily based on these 3 factors:
- No of touches – The more the touches, the stronger it is.
- Angle of the trendline – Flatter the trendline, the stronger it is.
- Length of the trendline – The longer the trendline, the stronger it is.
When using the Auto-Trendline feature, the blue trendline is a strong trendline compare to the red trendline. Let’s see an example to get a more clear picture.
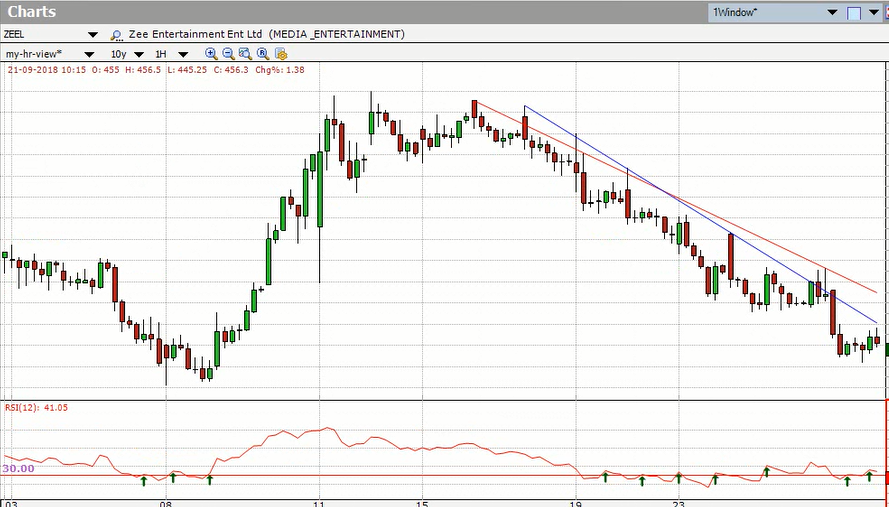
Above is a 1-Hr Candlestick Chart of Zeel (Zee Entertainment Enterprises Limited). As you can see the blue line is having more touches compare to the red one (not much difference in the angle). This means that more weightage should be given to blue trendline break compare to the red trendline break because the blue one is stronger.
Duration of a Trendline
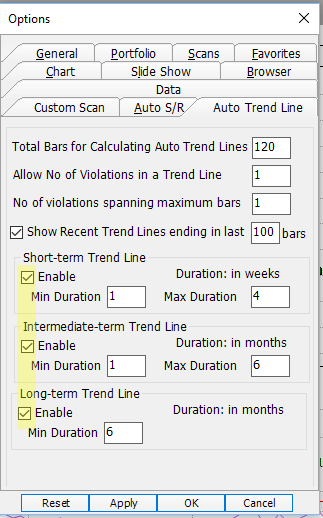
A trend varies in length (duration) – it can be either short, intermediate or long-term trend. These are hard to pinpoint since different traders have a different understanding of the duration of trends. What is important to realize here is that you can define a trend by its duration, as well, and that the duration of trend used by any trader will depend on the type of trader you are. E.g. a short-term trend can be 1 week to 4 weeks in duration while a long-term trend can be > 6 months.
The Auto-Trendline can be configured with the following options available in Tools->Options->Auto-Trend Line:
To summarize, the Auto Trendline feature will also allow a lot of other benefits in a very easy manner. e.g., you can now do the following:
- You can quickly get current trends right on your chart based on the current timeframe so you can easily spot the overarching trends in any timeframe.
- Colored lines plot on trends for a more in-depth analytical view of trends across time.
- You’ll easily analyze the current strength and resistance levels based on real-time so you can accurately determine which ones to use in your chart.