RSI Indicator (Relative Strength Index)
The relative strength index (RSI),one of the most well-known technical indicators, created by J. Welles Wilder and published in a 1978 book, New Concepts in Technical Trading Systems, and in Commodities magazine (now Futures magazine) in the June 1978 issue.
The RSI is classified as a momentum oscillator, measuring the velocity and magnitude of directional price movements. Momentum is the rate of the rise or fall in price. The RSI computes momentum as the ratio of higher closes to lower closes: stocks which have had more or stronger positive changes have a higher RSI than stocks which have had more or stronger negative changes.
How to use RSI Indicator
The RSI is most normally used on a 14-day or 21-days (Sometimes 7-days) timeframe, measured on a scale from 0 to 100, with high and low levels set apart at 70 and 30, respectively. In between the 30 and 70 level is considered neutral, with the 50 level a sign of no trend.
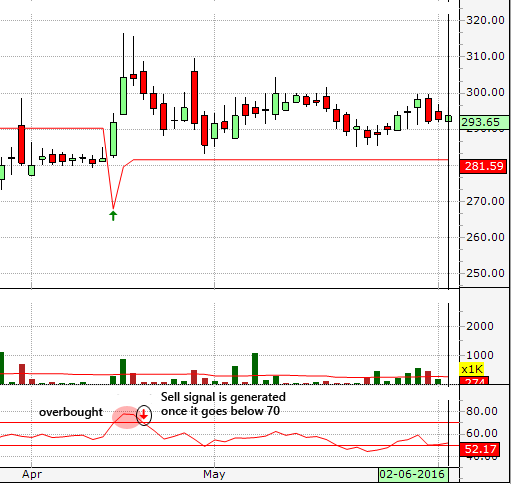
If RSI goes above 70, it is considered to be overbought and time to think of selling. Sell signal is however generated only once it goes below 70.
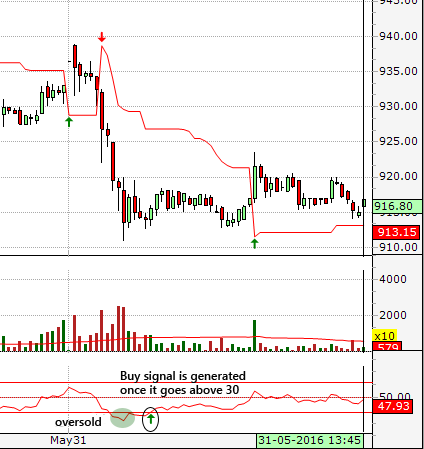
If RSI goes below 30, it is oversold and it is time to think of buying. Buy signal is generated once it goes above 30.
RSI Divergences
According to Wilder, divergence between RSI and price action is a very strong indication that a market turning point is unavoidable. Bearish divergence occurs when price makes a new high but the RSI makes a lower high, thus failing to confirm. Bullish divergence occurs when price makes a new low but RSI makes a higher low.
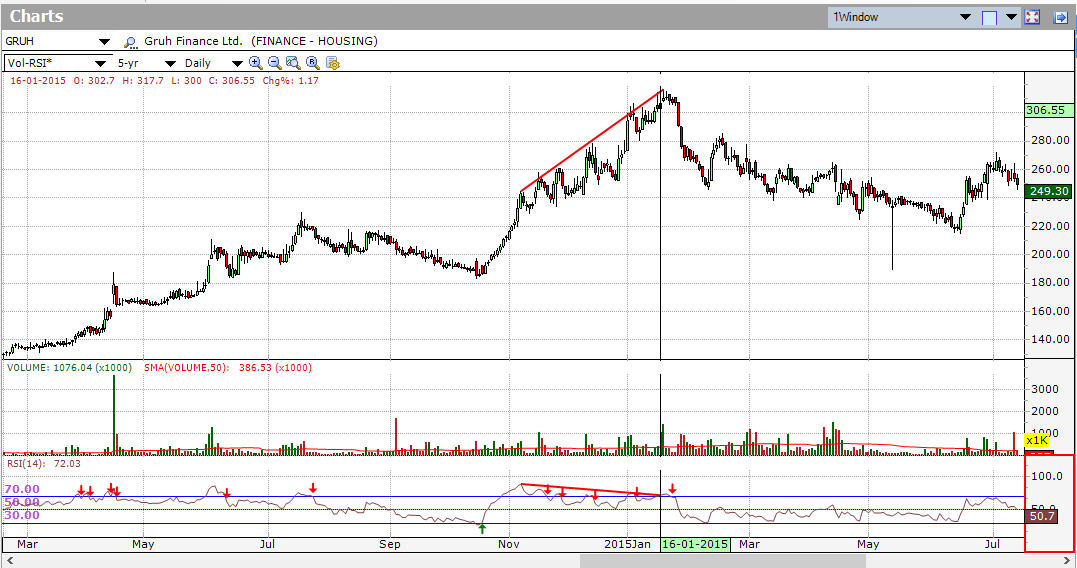
Figure below shows Gruh Finance LTd. (GRUH) with a bearish divergence in November 2014 to January 2015. The stock moved to new highs from November 2014 to January 2015, but RSI formed lower highs during the same period, thus forming the bearish divergence and indicating that a reversal is imminent.
RSI is a pure oscillator, and hence it does tend to give false signals when the market is trending; but compared to other oscillators it does tend to give lesser false signals. To avoid the false signals, we can use a simple combination of an RSI followed by a trending indicator like an EMA crossover to try to eliminate false Buy/Sell signals and as a better indication of a change in trend. To find more about this strategy, read How to use Multiple Indicators to reduce false signals.