Definition
Spread charts are a combination of two symbols. When you want to plot a chart of 2 symbols related in some way by an operator that is basically a spread chart.
Trading using spreads has been gaining in popularity because they provide a new perspective of a financial instrument’s value and can also help to alleviate some risk.
To enter a spread in Investar, enter the first symbol; next enter an operator (/) for division (+) for addition (*) for multiplication and (/) for division and then the next symbol.
Let’s look at the popular examples of spread chart for better understanding
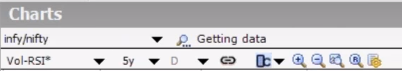
Suppose you want to track two symbols, let us say INFY and WIPRO (Serving the same industry i.e. computer software) and we want to track the relative performance of one symbol vs the other, so we would use the divide symbol and we will plot INFY/WIPRO in the chart and then we can see how the chart is moving with respect to time.
If the INFY is doing better with respect to WIPRO then we can see a chart goes up and if INFY is performing poor compared to WIPRO then we can see the chart will basically go down.
In the above 1year weekly chart, we can see that during this time the INFY was performing worse compare to NIFTY and then around October 2017 is when it actually started to perform better compare to NIFTY and it started going up.
Popular use of Spread Charts for Spread Trading
Pairs trading
The pairs trade or pair trading is a market neutral trading strategy enabling traders to profit from virtually any market conditions: uptrend, downtrend, or sideways movement. This strategy is categorized as a statistical arbitrage and convergence trading strategy.
The strategy monitors the performance of two historically correlated securities. When the correlation between the two securities temporarily weakens, i.e. one stock moves up while the other moves down, the pairs trade would be to short the outperforming stock and to long the underperforming one, betting that the “spread” between the two would eventually converge. The divergence within a pair can be caused by temporary supply/demand changes, large buy/sell orders for one security, a reaction for important news about one of the companies, and so on.
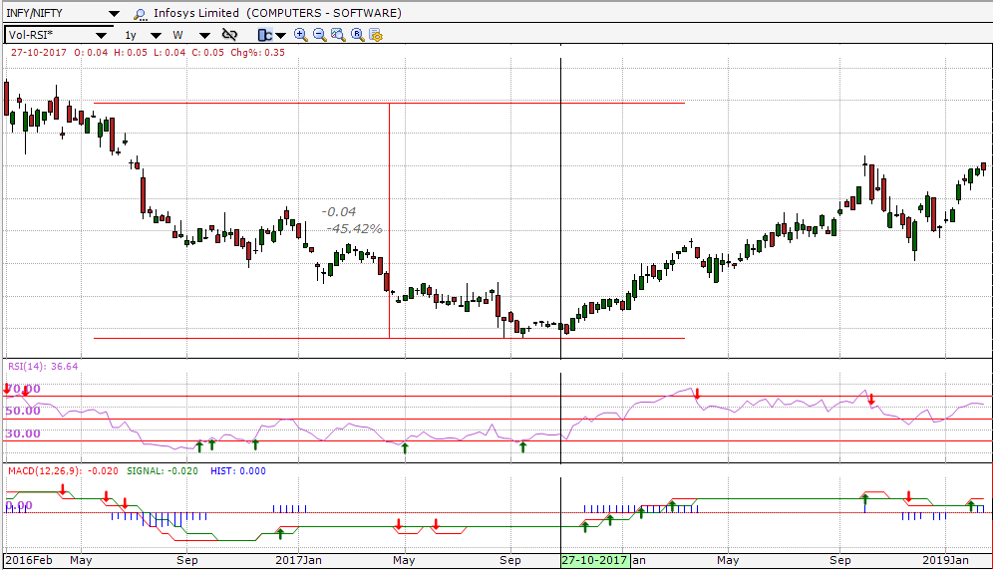
Let’s take an example of Graphite and Heg company chart to display a correlation.
The above image even visually may confirm that the stocks are correlated dynamically.
Pairs trading strategy demands good position sizing, market timing, and decision-making skill. Although the strategy does not have much downside risk, there is a scarcity of opportunities, and, for profiting, the trader must be one of the first to capitalize on the opportunity.
Arbitrage
Arbitrage is the practice of taking advantage of a price difference between two or more markets or exchanges. We will need to subtract the symbol for one exchange from the symbol from another exchange.
In Indian markets stocks are traded in two major exchanges – NSE (National Stock Exchange) and BSE (Bombay Stock Exchange), which means you can take advantage of buying the stock in one exchange and selling it in other and bag the difference as profit.
A Simple Arbitrage Example
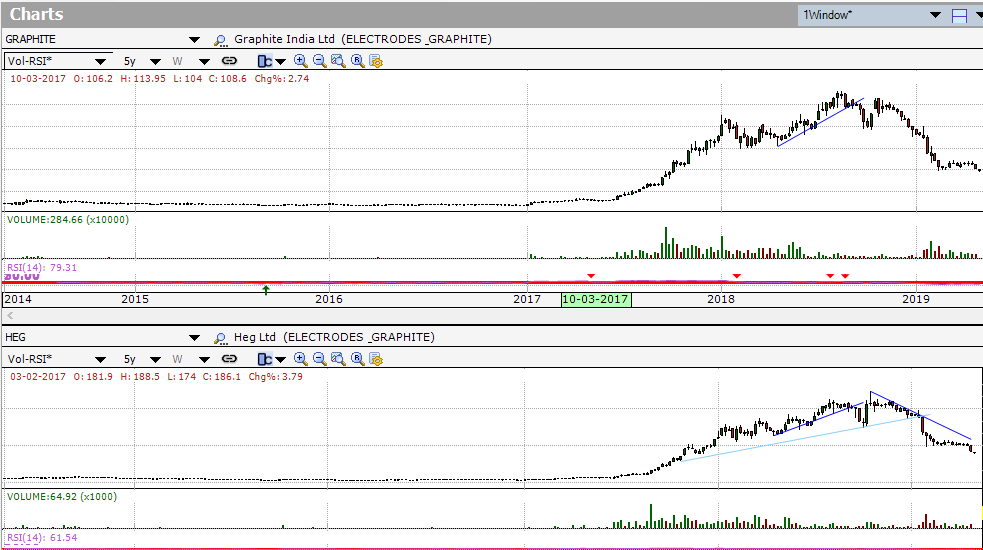
As a simple example of arbitrage, consider the following. The stock of Company X is trading at Rs.20 on the NIFTY while, at the same moment, it is trading for Rs.20.05 on the BSE. A trader can buy the stock on the NIFTY and immediately sell the same shares on the BSE, earning a profit of 5 paisa per share. The trader could continue to exploit this arbitrage until the specialists on the NIFTY run out of inventory of Company X’s stock, or until the specialists on the NIFTY or BSE adjust their prices to wipe out the opportunity.
For more clear understanding lets take a look at the below image of INFY symbol (INFY- Nifty and 500209 – BSE)
Final Thoughts
Spread trading is more complicated than outright trading and requires a higher degree of sophistication on the part of the trader. Spread Charts play a key role in doing spread trading. We hope this blog post helped in initiating a trader into the world of Spread trading.