In this blog, we will find out how to find stocks with short-term gains of > 30% by using Auto-Support/Resistance volume breakout strategy on examples of a couple of stocks.
Here’s a chart of Venus Remedies which shows a gain of 55% in 4 days.
Lets start by enabling Auto-Support/Resistance by right-clicking on the chart and then selecting “Enable Auto-SR”.
This draws the Auto-Support/Resistance lines. The dark blue lines are very strong resistance lines and any break of that can be considered a stronger buy signal compared to a light blue one. As we can see, Venus Remedies did a Very Strong Resistance breakout along on very strong volume on 16 Nov, 2018. If you bought it at the opening price of Rs 44, that would be a phenomenal short-term gain of 55%. The question is how can we catch such breakouts.
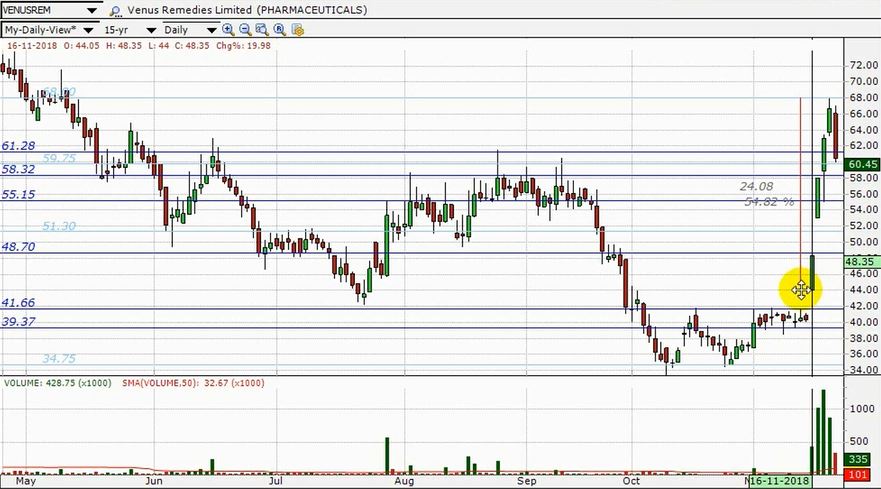
Venus Remedies Volume Breakout
Many of the times though, the stock surges so much above the resistance breakout point that it becomes difficult to chase it afterwards.
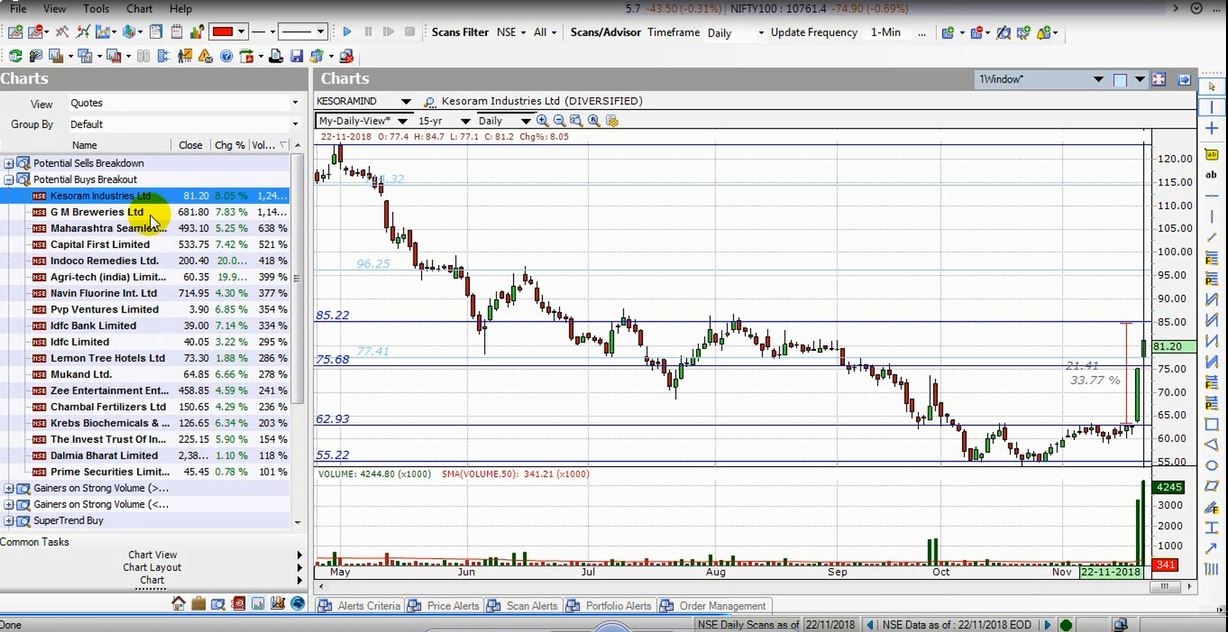
So let’s look at another example of Kesoram Industries. This stock also did a similar breakout around the same time and would have showed up on 21st Nov, 2018, in the “Potential Buys Breakout” scan.
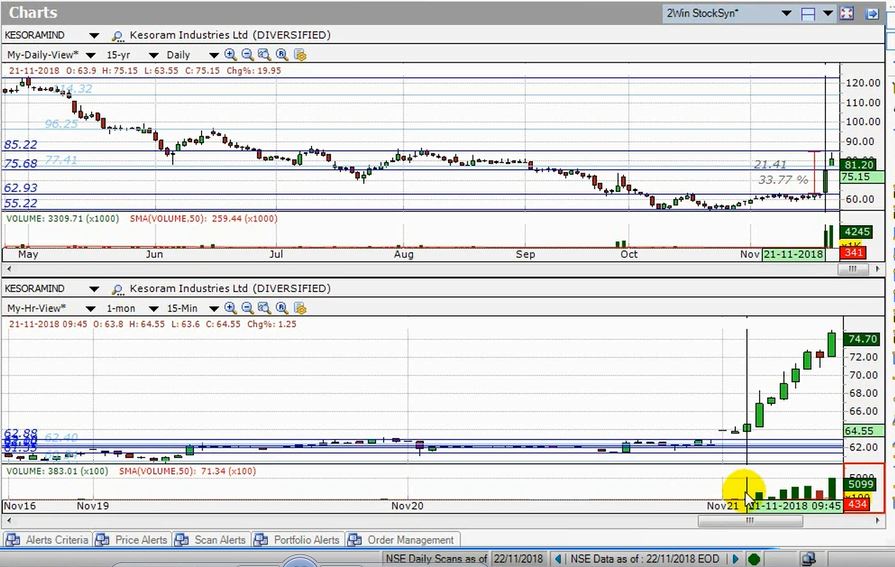
To find out how we can capture a stock surge like that early, you need to look at the stock chart in multiple timeframes.
When we look at a 2-chart layout in multiple timeframes, we see that the stock actually broke out on a 15-min timeframe first and the volume surge and breakout also reflected in the Daily timeframe after a short while within a few bars, both on above average volume, as shown in the chart below.
Both the stocks also exhibited a sideways trend of 1-2 months before they shot up, so that is also a good filter to eliminate false breakouts. And finally, always ensure that the stock has a high risk-reward ratio
To summarize, the following factors are very important to identify short-term multibaggers:
- Very Strong Resistance Breakout (Or Supply Zone Breakout) on High Volume.
- Long Sideways Trend
- High Risk-Reward Ratio (i.e. high reward compared to risk)
But, beware, such short-term volume breakouts can be short-lived and one should always make sure to take profits when it reaches a target. The target can be derived again from an auto-resistance level above the current price. E.g. in case of Venus Remedies, it so happened that the stock started reversing at the auto-resistance level of Rs 68 (as shown by the light blue line in the chart above).
Check out our video on “Identifying Short-Term Multibaggers using Auto-Support/Resistance” for an in-depth look into this topic :
Whether you have EOD scan which identifies the stocks which have volume increasing progressively last three candles. It’s for short term trading .
Yes, we do have a scan, ‘Gainers on Strong Volume – Last 3 bars’, which scans for stocks going up on above average volume for last 3 bars. In addition, our custom screener can be configured to have a volume breakout as per your specific price/volume criteria.