We are pleased to announce a new release of Investar Beta and with many new exciting features, improvements, and even better usability.
So what are the new features you can expect from Investar Beta Version?
Auto Divergence in Chart
Before we head out there and start looking for Auto Divergence, Let us first understand what Divergence is.
Divergence is where the price of a stock and a set of relevant indicators, e.g., the MACD, stochastic oscillator, RSI, etc… are moving in opposite directions. A divergence happens when price makes higher highs, but the indicator makes a lower high, it implies that “something” is going on that requires your consideration.You can also see our blog to learn more about divergence.
So as per customer feedback, we have added a new feature “Auto Divergence” as it can help you to find normal as well as hidden divergences in chart without any hassle.
The most popular Auto Divergence is what we are try to support are:
- Price-MACD Divergence
- Price-RSI Divergence
- Price-SlowStochastics Divergence
- Price-CCI Divergence
The Auto Divergence can be configured with the following options available in Tools->Options->Auto Divergence:
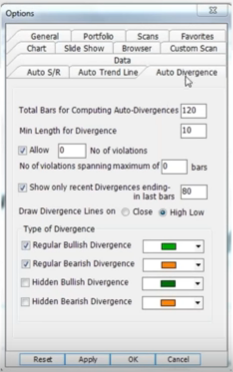
All details are in the video below for your clear understanding. (Link)
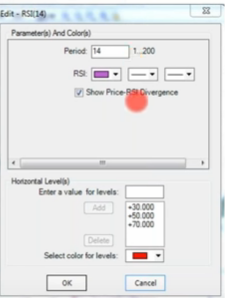
Note: Make sure that for the particular indicators the check box is selected.
For example, if we enable Auto-Divergence setting and have RSI on the chart, we need to make sure that the indicator setting has the “Show Price-RSI divergence” as checked.
Spread Charts
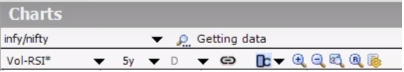
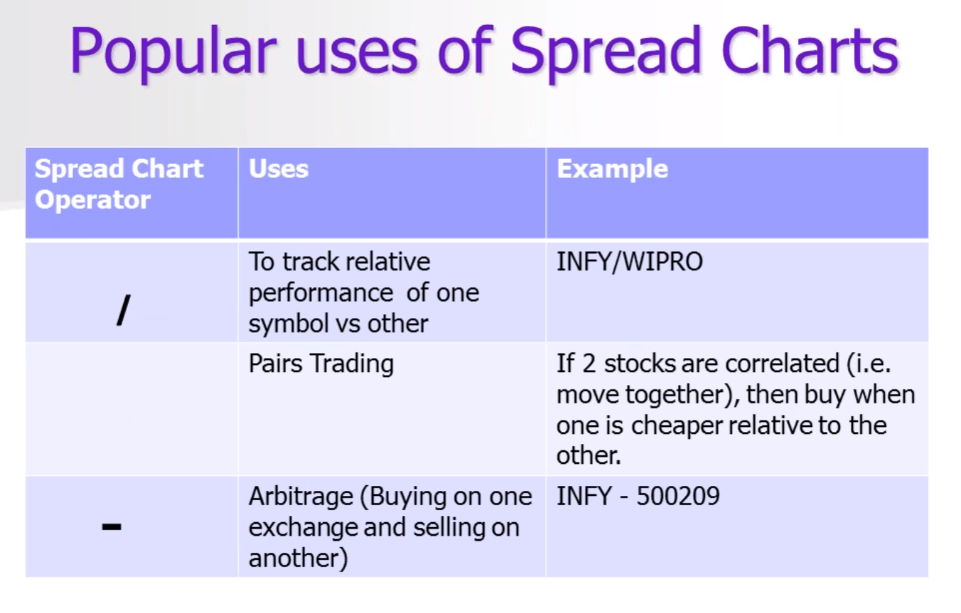
We made something that no one has made in charts to date (as far as we know).Trading using spreads has been gaining in popularity because they provide a new perspective of a financial instrument’s value and can also help to alleviate some risk.
To enter a spread in Investar, enter the first symbol; next enter an operator (/) for division (+) for addition (*) for multiplication and (/) for division and then the next symbol.
Heiken-Ashi scans
Heikin-Ashi scans are now available in our Beta. It can be added for Intraday, daily, weekly & monthly ranges.
HeikenAshi scans use Heikin-Ashi candles instead of normal Japanese candlestick candles for all the scans. We are supporting it in two categories: candlestick and limited indicators (RSI, MACD, SUPT, EMA, ADX, ATR, CO, EMA on RSI, FI, PPO, TRIX, VROC).
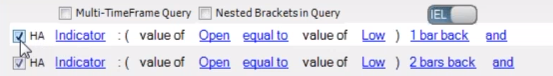
Now, if you want to get Heikin-Ashi scan you just have to tick the box of “HA” next to the indicator category and then you will be able to get your scan for the Heikin-Ashi candles.
Some other features such as:
- Investar Query Language – for more advanced Custom Scans
- Support for Hybrid IEL-IQL mode, IQL Only mode and IEL Only mode.
- Auto-Trendline scans.
- Auto-SR zone scans.
- Chart Keyboard Short-cuts
- Linking of ChartView->time-frame with ScansAdvisor->time-frame for faster navigation of scans
- Many more…
What are the new Changes in Beta?
- Removed 4min, 2hours, 4hours, 2day, 3day chart pre-defined timeframes.
- Preloaded 75-min custom timeframe to enable 75-min custom scans.
Which bugs have been fixed in Beta?
- Drawing support for custom timeframe.
- Fixed issue related to DayOpen in custom scans.
- CPU performance fixes while using custom scan.
- Unnecessary download of active futures data for custom scans.
- Many more…
For more details, see this video below:
If you are already using Beta version, it will upgrade automatically when we release it.
In case you are not using the Beta version, we highly recommend that you download and use Investar Beta as soon as we release it and Feel free to let us know what you think.
Once we get enough feedback, we will be releasing this Beta to all users as a production release. What’s more, Investar 5.5 and Investar Beta can run simultaneously, so it will not affect your normal usage.
Stay tuned!