Today is the day! We are pleased to announce a new release of Investar Beta and with it many new exciting features, improvements, and even better usability.
What’s New?
Auto-SR Zone Detection
As per customer feedback, we have added a new feature “Auto-SR Zone Detection” widely also known as “Auto Supply-Demand Zone Detection”.
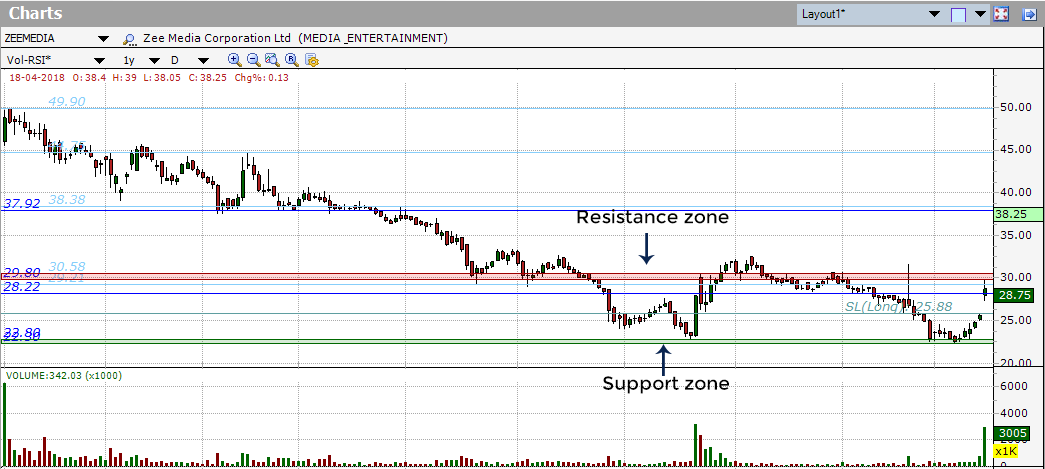
Supply-Demand Zones (or Support-Resistance Zones or SR Zones for short) are areas of supply/demand created in the chart. Nearby Support/Resistance lines can be clubbed together to create a Support/Resistance zone. Using S/R zones instead of S/R lines can improve the accuracy of trading immensely as it can help you to avoid false buy/sell signals as well as give better targets and stop losses.
To enable Auto SR zones, just right click on the chart as shown below:
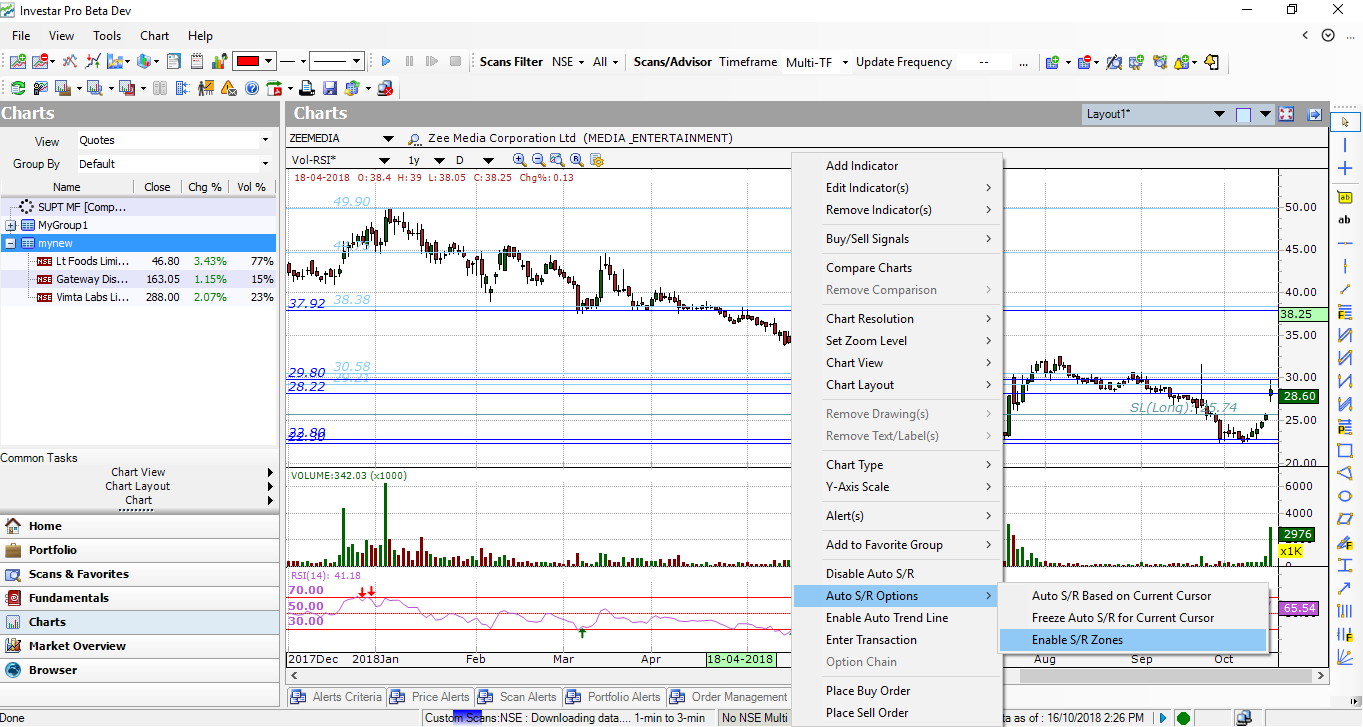
Simply click on “Enable S/R Zones”, then you will be able to see S/R zones
Note: You have to Enable Auto S/R in order to use this feature.
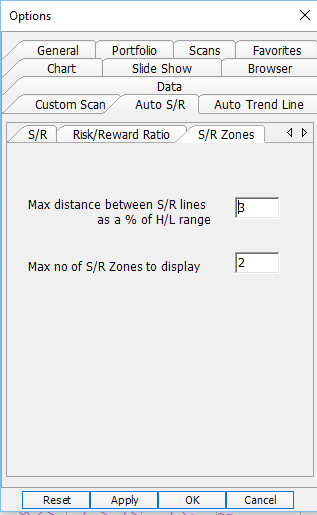
To configure Auto-SR Zones, please do the following:
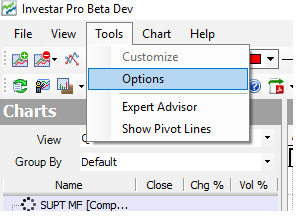
- Select Tools->Options from the main menu
- Select the Auto S/R tab and then the S/R Zones sub-tab.
All details are in the video below for your clear understanding.
Auto Trend Line support in the chart
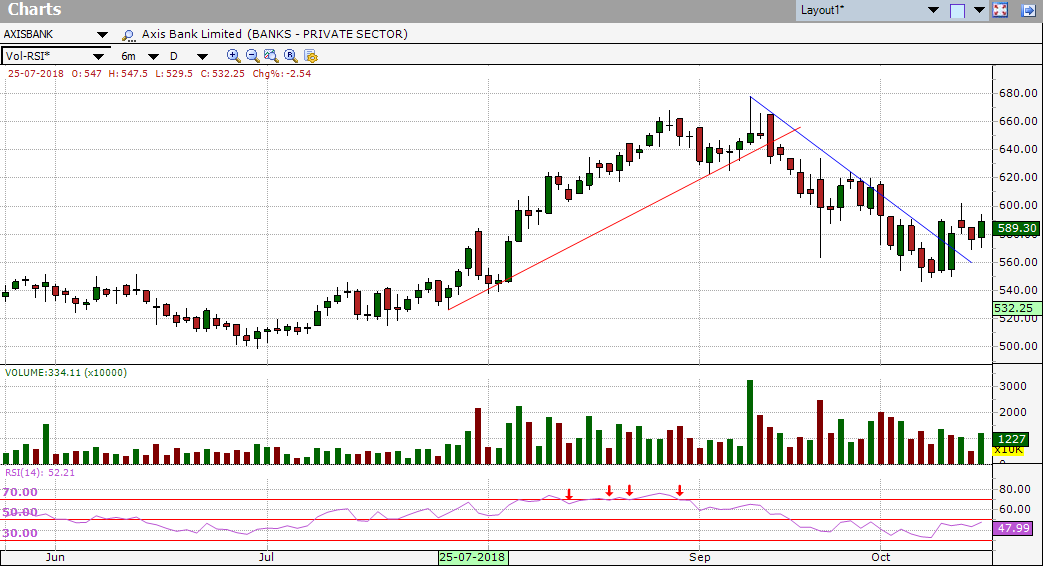
The auto-trend line feature determines the current uptrend and down trend line and draws them.
Trend lines may also be drawn manually using the drawing tool on the charting toolbar, but with our new feature Auto Trendline feature, it not only does it automatically but also colors the trend lines based on strength (blue for strong, red for not so strong).
To enable Auto Trendline:
Step 1: To configure it, select Tools->Options option on the main menu:
Step 2: Select Auto Trend line tab and configure its settings
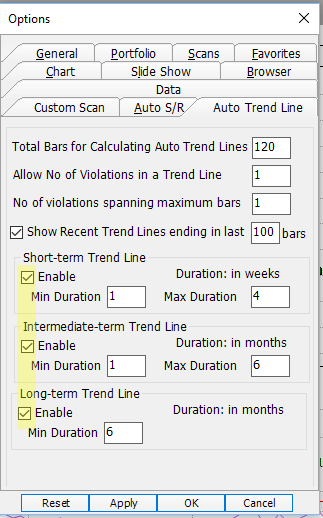
Step 3: To view Auto Trend line make sure you have checked the options for Trendlines and Click OK.
Step 4: Now, simply Right click on the Chart and click Enable Auto-Trend Line as shown below.
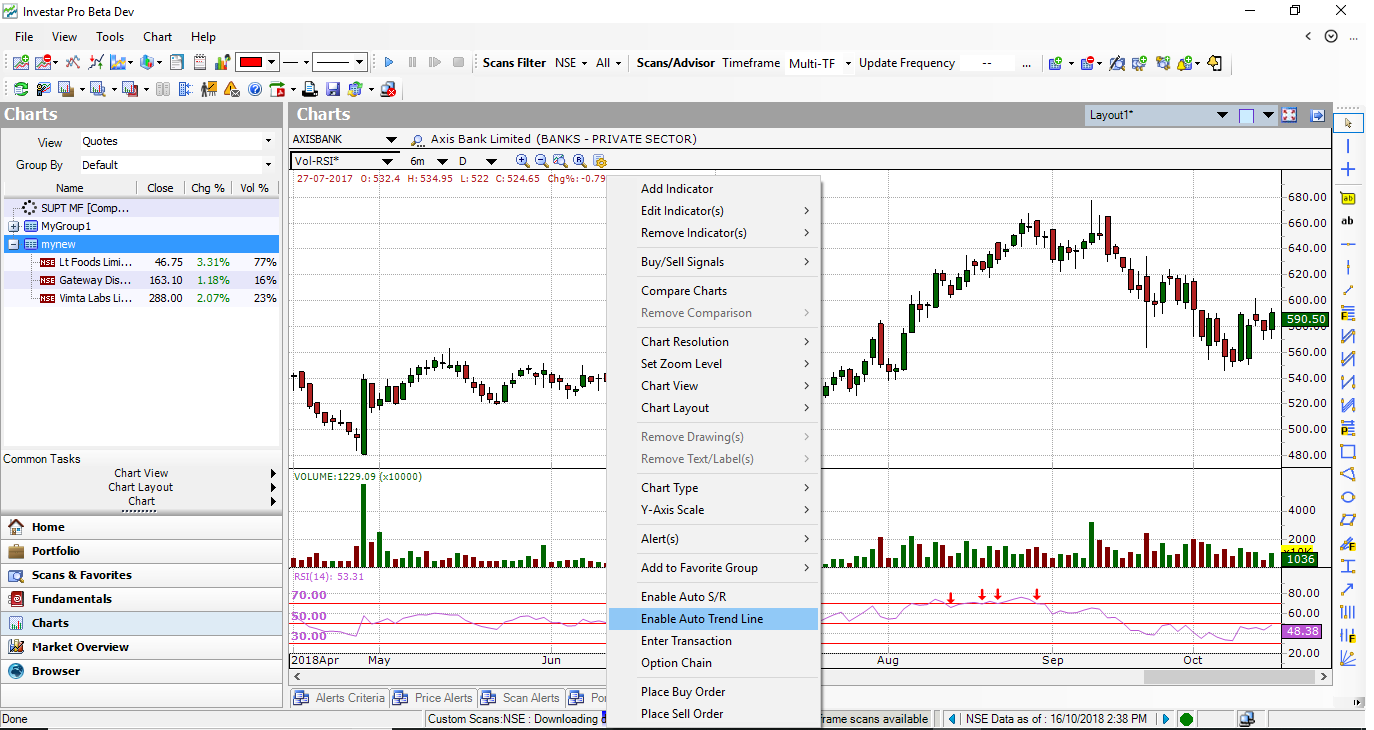
and you can see the Trendlines on your selected chart.
For more details, see this video below:
Custom Timeframes & Align Candles to Market hours
You can now add custom timeframes to the software. Simply do the following:
- Select Tools->Options from the main menu
- Select the Data tab
- Enter a Custom Timeframe and then click Add button. The timeframe will be added throughout the software (e.g. in charts, custom scans and scan alerts).
- If you check the “Align candle grouping to market hours”, then the candles will be aligned to market hours. (e.g. for Hourly timeframe, first candle will be 9:15 am to 10:15 am instead of 9:15 am to 10:00 am, if this option is not checked.

For more details, see this video below:
New Price Action Pattern Scans:
We have added many Price Action Pattern Scans like:
- Opening Range Breakout
- NR4
- NR7
- Bullish/Bearish Reversal Bar
- Bullish/Bearish Key Reversal Bar
- Bullish/Bearish Exhaustion Bar
- Bullish/Bearish Pin Bar
- Bullish/Bearish Two-Bar Reversal
- Bullish/Bearish Three-Bar Reversal
- Bullish/Bearish Three-Bar Pullback
- Inside Bar
- Outside Bar
- Three-Bar Inside Bar
- Bullish/Bearish Exhaustion Bar
20+ new indicators in Custom Screener
We’ve added many new indicators in the Custom Screener as follows:
Moving Averages: DEMA, TEMA, WMA
Oscillators: Vortex, MFI, PSAR, Aroon, Williams%R, ForceIndex, Momentum, PROC, VROC, PPO, Chaikin Oscillator, Elliott Wave Oscillator, StochRSI, Vortex
Volatility indicators: Price Channels, Donchian Channels, %B
Miscellaneous: Typical Price, Standard Deviation, Chandelier Exit
For more details on Price Action Scans and new Indicators in Custom Screener, see this video:
Some Other features such as:
- Nested Bracket support in custom scans to create complex conditions.
- Sub-Query enable/disable support in custom scan.
- Delivery Volume in chart and custom scan now available.
What are the new Changes in Beta?
- New Menu for Chart timeframe and duration for better visibility.
- Indicator names have been made more readable.
- Add option to save Scan results in the single text file.
- Add Label in Prev day/Today OHLC lines for better visibility.
- Add new option to remove Indicator from the chart area when all chart area are full while adding new indicator.
- Provide support for new Zerodha contract note.
- On login, Password can be saved with a user id.
Which bugs have been fixed in Beta?
- Some add-ons were incorrectly enabled for Standard users.
- After a new query on Multi-TF, even after “All in sync” it was showing “no scans/computing”.
- Sometimes the software took a lot of hard disk space.
- Sometimes Investar Beta was stuck in custom scan restart.
- Investar Beta used to minimize when any progress form is closed.
- Investar Beta crashed if custom scan query editing is done more than 300 times.
- Group scan alert not working when editing for cash scrip.
Watch What’s New in Investar Beta – in Hindi
Is it possible to import technical indicators?
Could you please clarify what you mean by importing technical indicators?
Dear Sir,
Do we get customised scan screeners for 120 min and 240 min as well.??
Last time i Checked, only 90 min was available.
Thanks
Yes, we do support scans for 120 mins and 240 mins in our Pro edition. You can get alerts for the same too