In this post, we will analyse the Nifty and find out if this is a Bear Market and even a start of a possible recession.
As shown in the chart below , in the last few weeks from the peak that occurred on 24 Jan, 2020, the market has corrected almost 20%. By definition, any correction of 20% or more in 2 months or less is a bear market, so this is indeed a bear market.

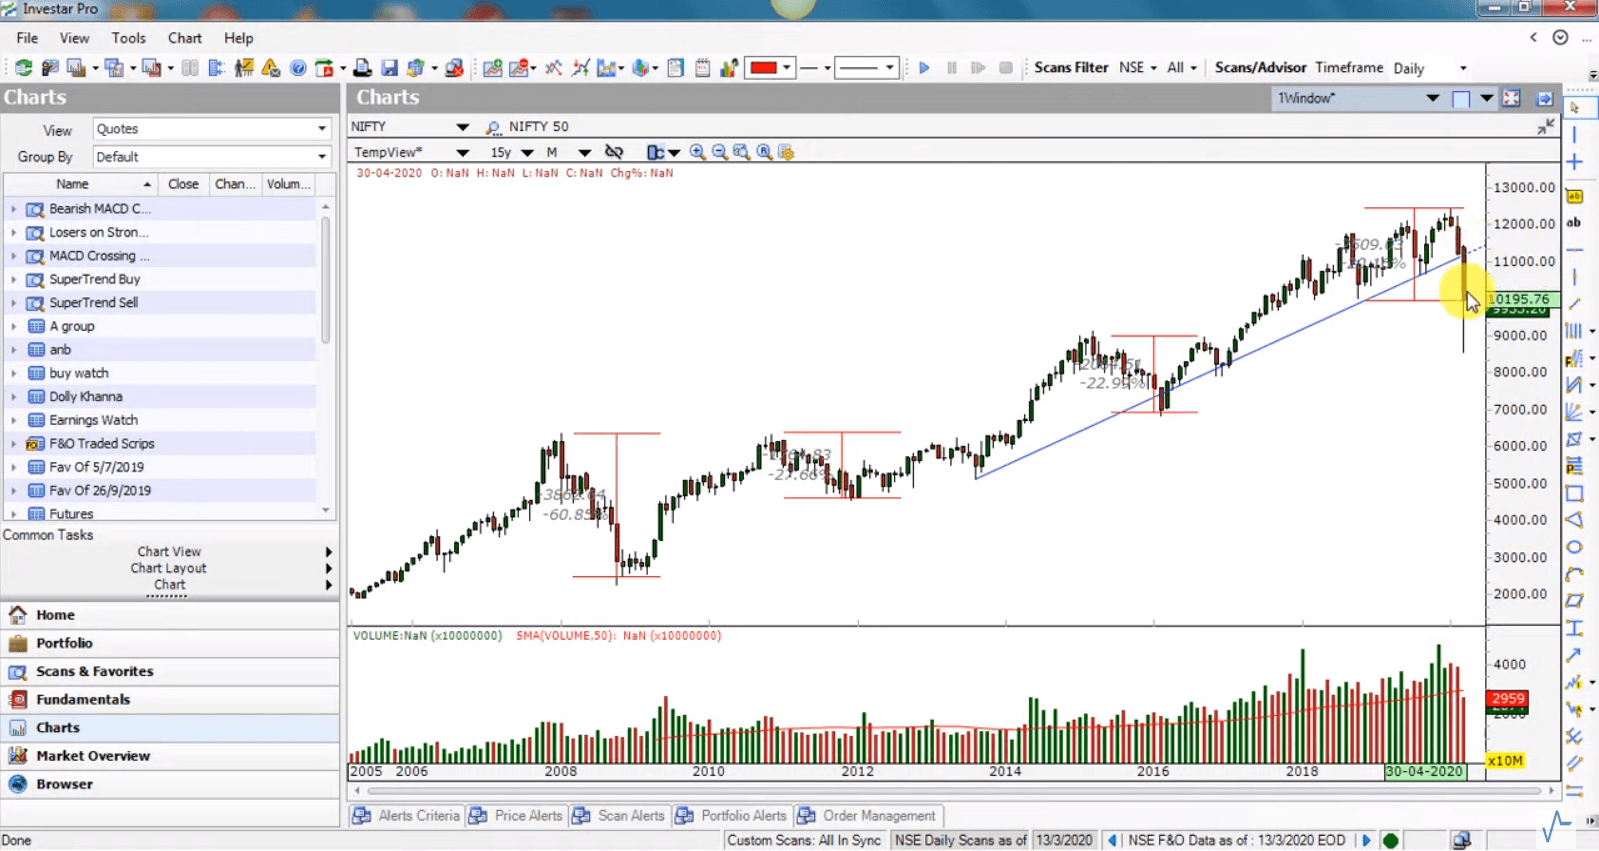
But let’s understand what our strategy can be in such a bear market. To understand this, we need to go to a monthly chart (see below ) and look at past bear markets in the last 15 years. We have had 3 bear markets:
- A 23% correction (from peak to low) in 2015-16
- A 27.6% correction (from peak to low) in 2011-12
- A 60.85% correction (from peak to low) in 2008-09

To understand if this bear market will lead to a long-term recession, let’s understand the circumstances behind the bear market. The correction has primarily been triggered by the fast spreading cases of Coronavirus, and since it doesn’t have a cure, many countries have introduced social distancing and lockdowns as a measure to control it. The effect of this on any country is drastic as it causes the economy to totally stall. Earlier it was only China that was affected, but since 2nd half of February it has rapidly spread into European countries like Italy and Spain and also USA.
Since there is a lot of uncertainty around this, the Nifty has corrected sharply (perhaps never in the past 25 years has it corrected so sharply). Moreover, if we compare the 20% correction to the past 2008 recession (which was triggered by financial collapse around the world), we can clearly see that the uncertainty around the coronavirus growth and the economic effect means that the market may go down even further in the next few weeks and months, hence leading to a possible recession. In fact, we are probably looking at a bear market and recession of atleast 6-9 months. And the correction could be as deep as 48% as shown in the chart below, or even deeper than the one in 2008 depending on how things go forward.

We can confirm this by looking at the monthly chart below, where the Nifty has broken the long-term uptrendline in Investar (based on Auto-Trendline feature) first time since 2014, which is an indication that the long-term bull market has clearly ended. Also, the volume is very high indicating that the selling is happening on high volume.
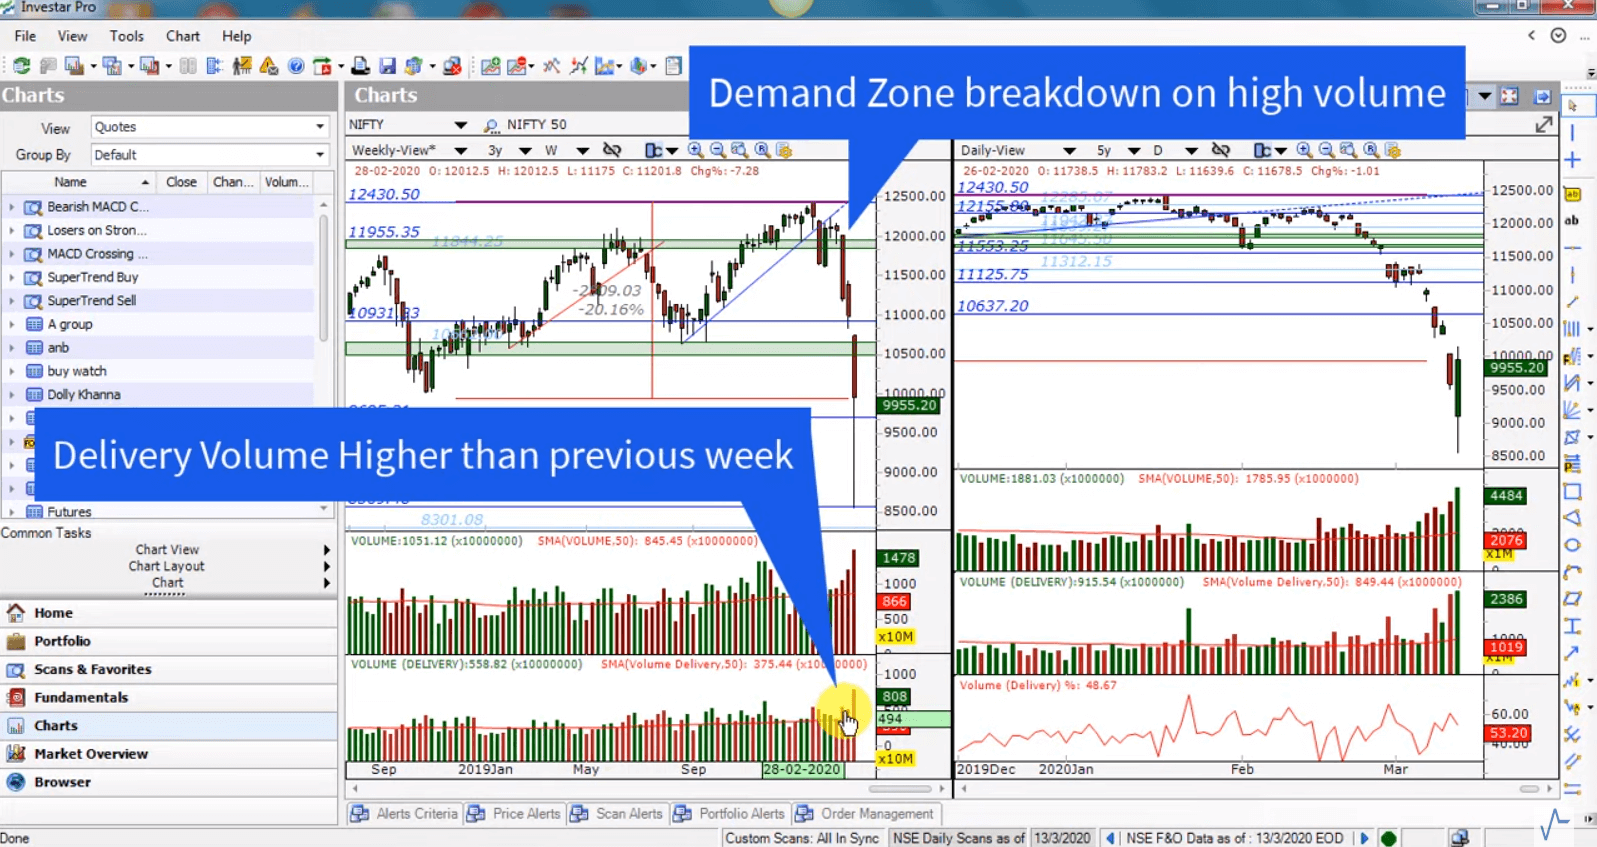
Even on a Weekly chart (as shown below ), we could see that in the week ended on 28 Feb, 2020, when the market went down and broke the demand zone, it did so on high volume, indicating that there was a lot of selling.
So the question is, how do we navigate this bear market? In a bear market, you usually have lower highs and lower lows. Hence, the strategy that every investor should have is to sell on rallies and make sure to not buy unless there are signs of a bottom.
In future posts and youtube videos, we will definitely post when we see the signs of bottoming out and a start of a possible rally. So stay tuned! But, meanwhile, do watch the following video which goes into this in a more detailed manner: