Gap is an area on a chart where the price of a stock moves sharply up or down, with almost no trading in between. A gap on a chart happens when the stock closes at one price but opens at a different price on next day.
Price gaps can be upside and downside and it can happen in any time frame. Gaps generally show up on daily price charts, yet they are also appearing on minute, hourly as well as longer-term charts.
For example, as shown by the figure below. The nifty closing price on 2nd May 2016 was 7807 and the next trading period opens at 7825. Since there were no trades in between, this had created a gap on the chart.
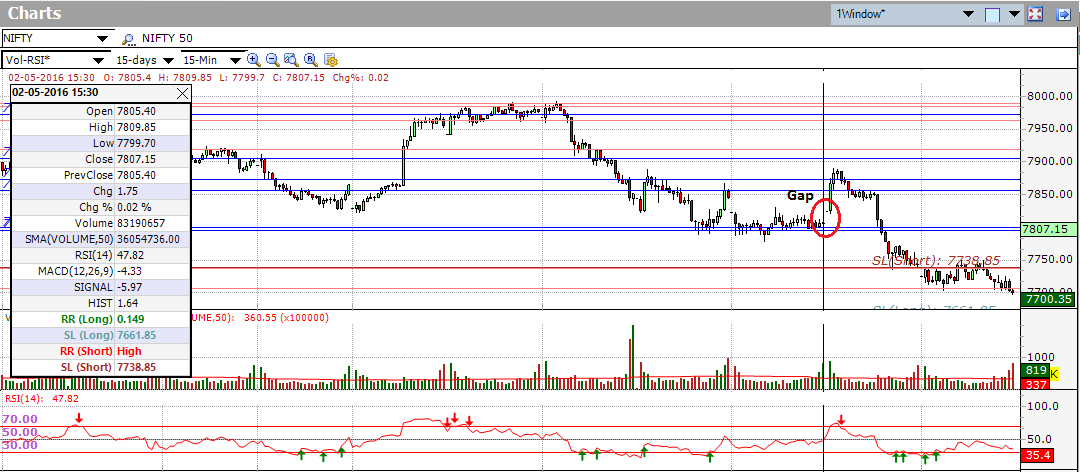
It is usually said about gaps that they will always fill, i.e. that prices move back to the level they occupied before the gap. However, note that this doesn’t always happen.
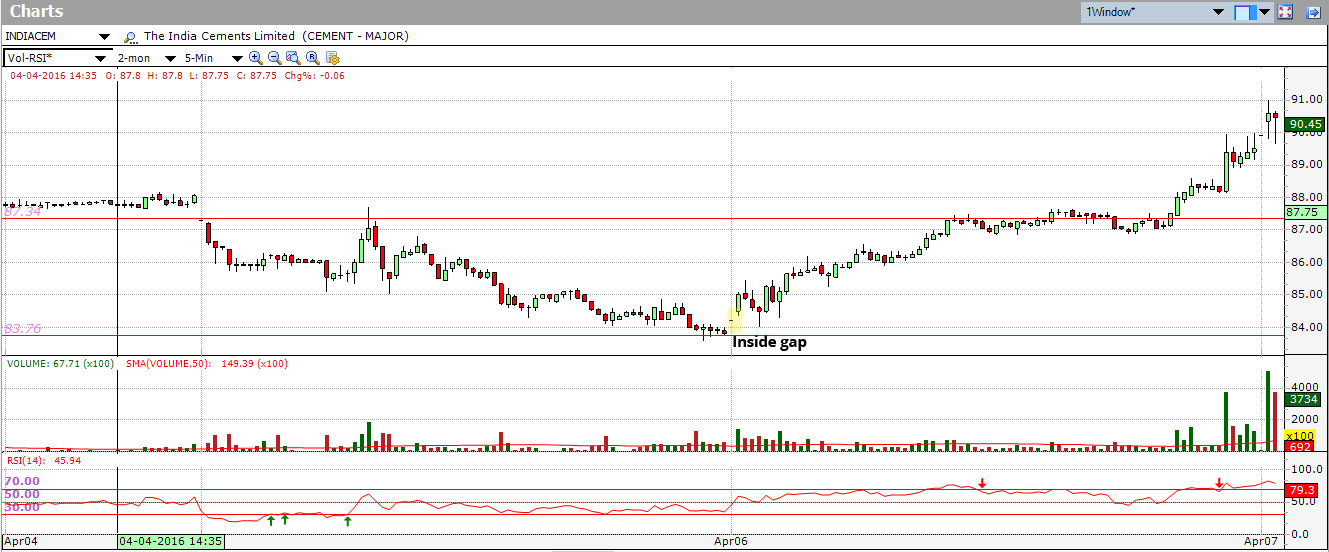
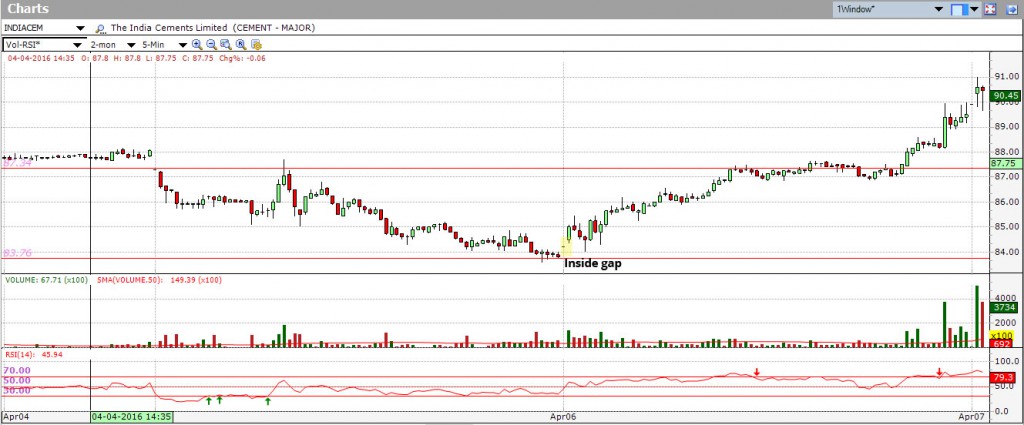
If prices gap, do not open above the prior day’s high or below the prior day’s low, then the gap is called an inside gap and is likely to create a stronger intraday support/resistance.
If prices gap, open above the prior day’s high or below the prior day’s low, then the gap is called an outside gap and is likely to fill during that day.
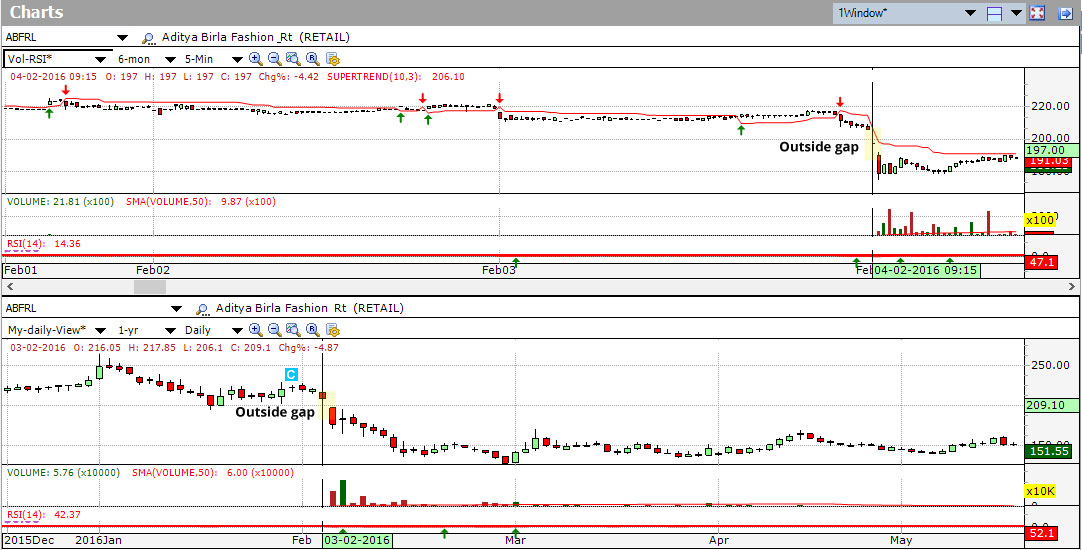
[Figure showing Outside gap in Intraday chart as well as in Daily chart]
Common Gap: also known as an area gap, pattern gap, or temporary gap. These types of gaps often occur when trading is bound between support and resistance level in a short span of time and market price is moving sideways.
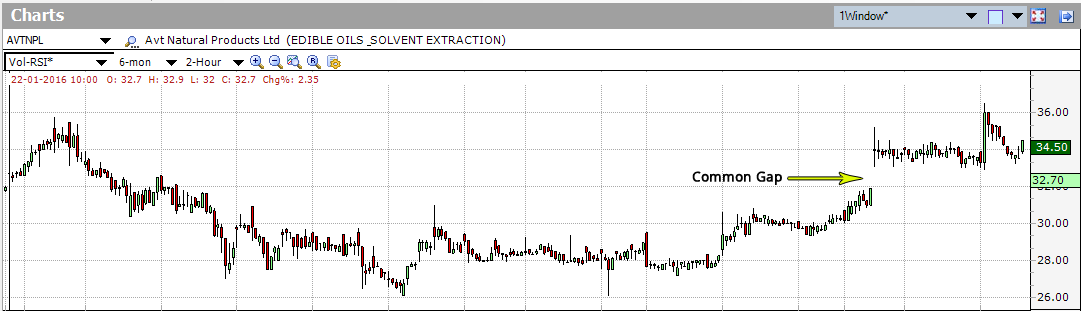
Usually, the price moves back or goes up in order to fill the gaps
Breakaway gap: occurs when prices break away from an area of congestion. A stock will be in sideways and after that all of sudden it will “gap away” from the price pattern. The gap can be over a support or a resistance level. One must keep an eye on the volume.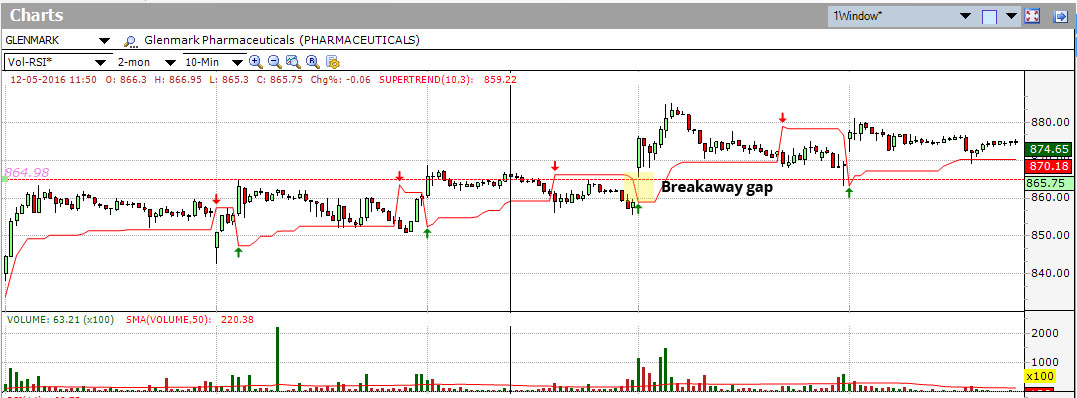
Measuring gap: also known as a runaway gap, and are best described as gaps that are caused by increased interest in the stock. It is not connected with the congestion area; it will probably happen roughly amidst a rapid advance or decline. This sort of runaway gap represents an almost panic state in traders. Runaway gaps are not normally filled for a considerable period of time.
Exhaustion gap: occur near the end of a price pattern and signals the end of a move. These gaps are associated with a rapid, straight-line advance or decline. They are distinguished by high volume and large value contrast between the previous day’s close and the new opening price.