Divergence is where the price of a stock and a set of relevant indicators, e.g., the MACD, stochastic oscillator, RSI, etc… are moving in opposite directions. A divergence happens when price makes higher highs, but the indicator makes a lower high, it implies that “something” is going on that requires your consideration.
There are two kinds of Indicator Divergence: Negative Divergence and Positive Divergence.
Negative divergence happens when the price has a higher high but the indicator fails to do the same, instead it has a lower low.
Positive divergence happens when the price has a lower low but the indicator fails to do the same, instead has a higher high.
Using divergence trading can be useful in spotting a weakening trend or reversal in momentum.
How to Trade MACD, Stochastic, and RSI Divergence
Divergences work on all indicators such as RSI, Stochastics, MACD, etc. Let us see them one by one.
A RSI divergence
Divergence signals give the trader a favorable position by confirming an entry into a downtrend as it weakens and just before it transforms into an uptrend. It is additionally used to escape an uptrend as it weakens, and before it collapses into a downtrend. The divergence signal does not happen each time a trend changes, but rather when it does, it conveys a solid confirmation signal that a trend break is likely. RSI divergence signals often show up ahead of time of a trend change, yet they are not good at proposing the time of a trend change.
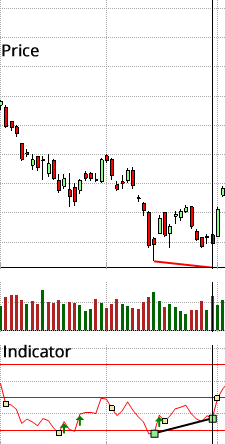
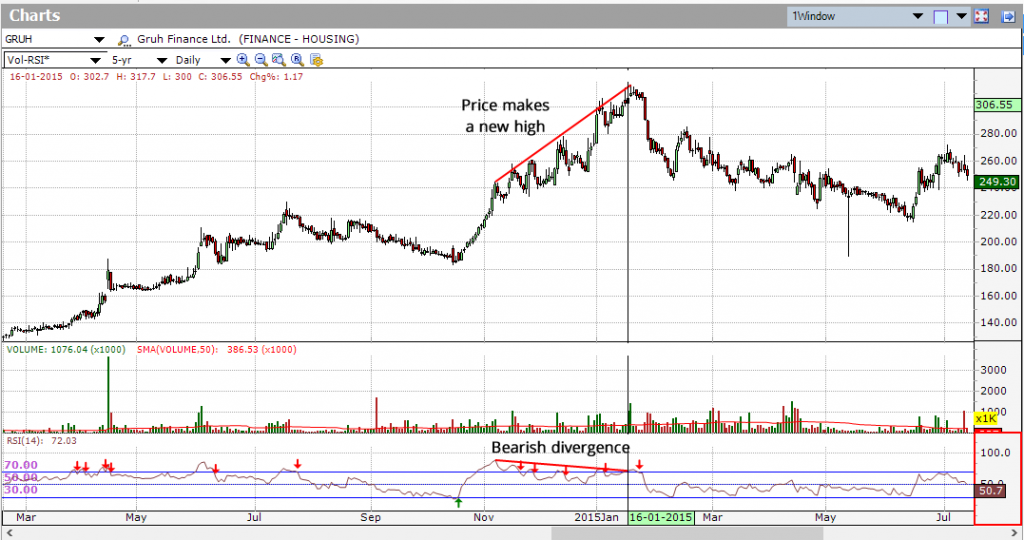
According to Wilder, divergence between RSI and price action is a very strong indication that a market turning point is unavoidable. Bearish divergence occurs when price makes a new high but the RSI makes a lower high, thus failing to confirm. Bullish divergence occurs when price makes a new low but RSI makes a higher low.
Figure below shows Gruh Finance LTd. (GRUH) with a bearish divergence in November 2014 to January 2015. The stock moved to new highs from November 2014 to January 2015, but RSI formed lower highs during the same period, thus forming the bearish divergence and indicating that a reversal is imminent.
A bullish divergence formed in February 2016, in Nifty50 (Nifty).As you can see in chart below, the stock moved to new lows from February 12, 2016 to February 29, 2016, but RSI formed higher highs during the same period.
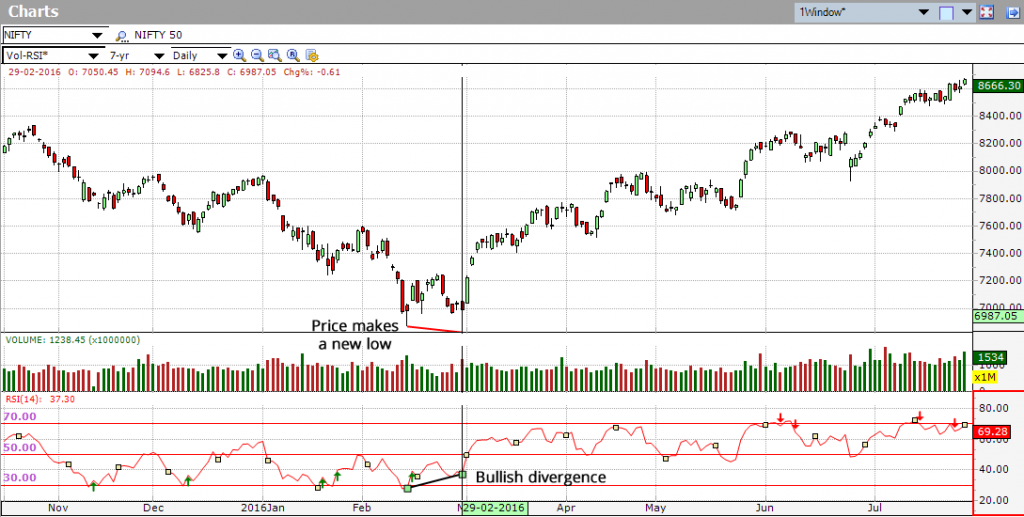
Traders utilize the RSI divergence as an early cautioning sign to engage them to get ready for a trend change.
It must be remembered that divergences are deceiving in a strong trend. A solid uptrend can demonstrate various bearish divergences before a top really appears. On the other hand, bullish divergences can appear in a strong downtrend – however the downtrend continues.
MACD Histogram Divergence
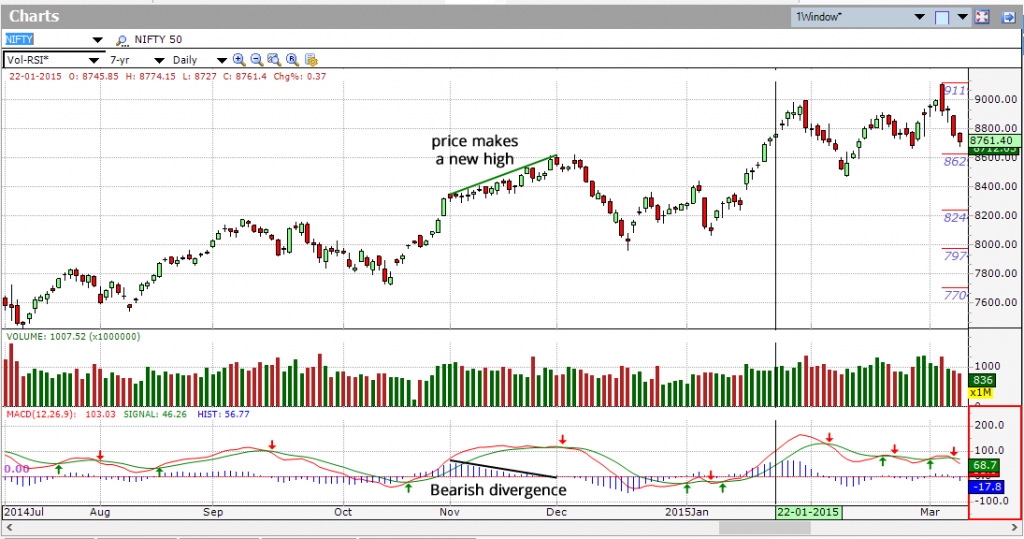
MACD Histogram Divergence (or “MACD Divergence” for short) is one of the most famous and the strongest trading signals that MACD generates. MACD Divergence forms when the price goes up and makes higher highs and at the same time, MACD bars go down and make lower highs.
A “positive divergence” or “bullish divergence” occurs when the price makes a new low but the MACD does not confirm with a new low of its own. A “negative divergence” or “bearish divergence” occurs when the price makes a new high but the MACD does not confirm with a new high of its own. A divergence with respect to price may occur on the MACD line and/or the MACD Histogram.
The next chart shows Nifty50 (Nifty) with a bullish divergence in August 2013. Notice that price moved to a lower low in August, but the MACD-Histogram formed a higher low.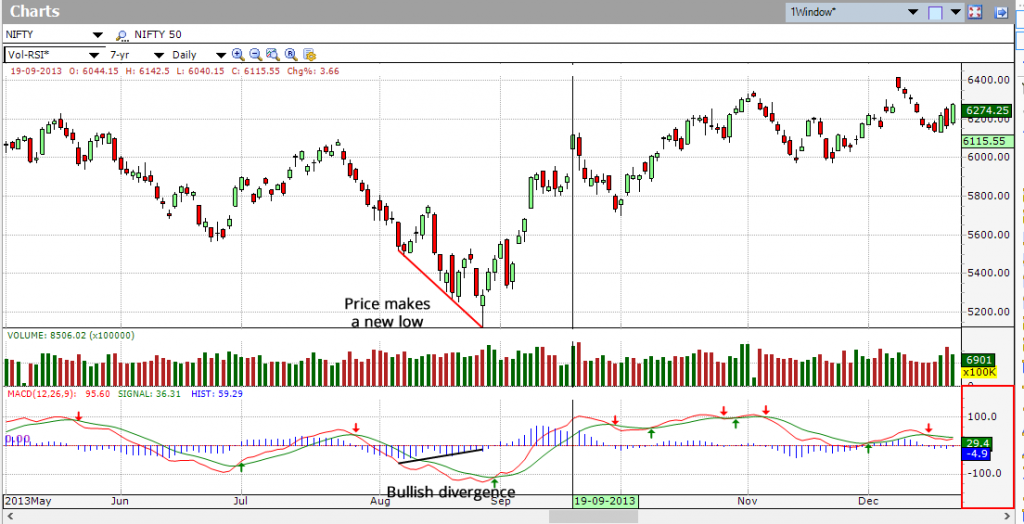
Below chart shows Rushil Decor Ltd (RUSHIL) with a bearish divergence in November-December 2015. Price moved to a new high in November-December, but the MACD-Histogram formed a lower high.
The divergence is a sign that the price is going to switch at the new high, and all things considered, it is a sign for the trader to go into a short position.
Stochastic Divergences
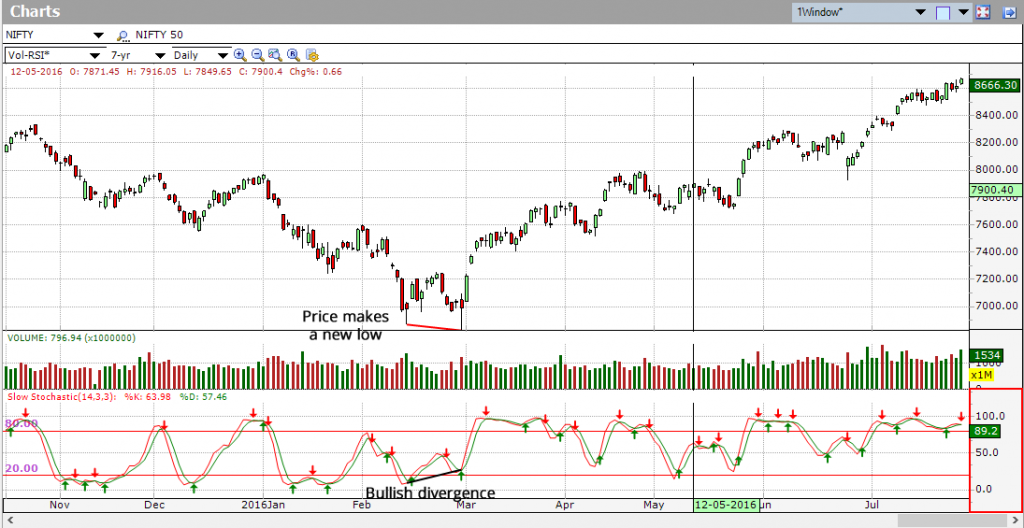
A divergence forms when the indicator doesn’t move in-accordance with price. A bullish divergence forms when the price makes a new low but the Stochastic Oscillator frames a higher low, it signals potential weakness. A bearish divergence forms when the price makes a new high, however the Stochastic Oscillator frames a lower high, it indicates potential strength. Once a divergence takes hold, trader ought to search for a confirmation to signal an actual reversal.
Below chart shows Visaka Industries Limited (VISAKAIND) with a bearish divergence from May – June 2016. The stock moved to higher highs in May, but the Stochastic Oscillator formed a lower high.
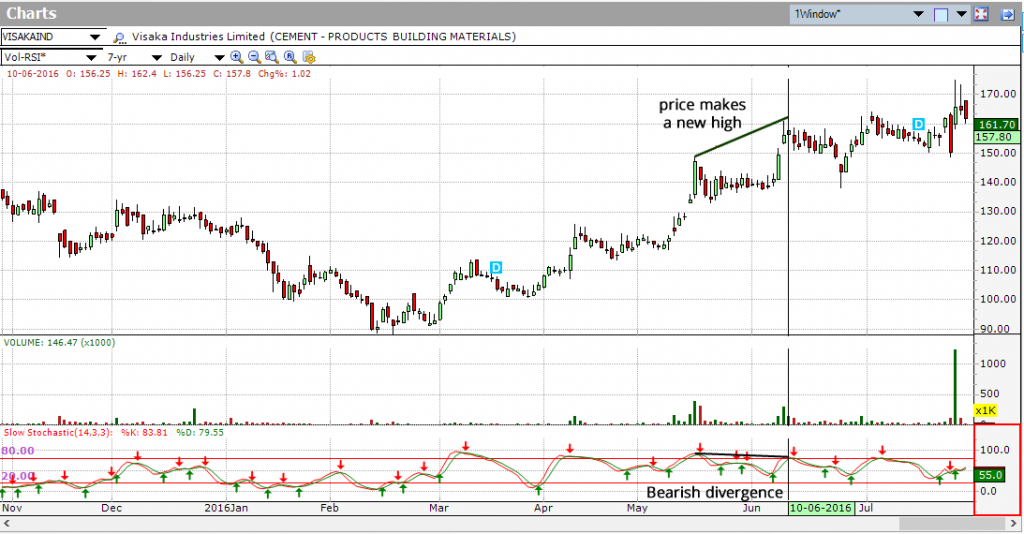
The next chart shows Nifty 50(Nifty) with a bullish divergence in February 2016. Notice that Price moved to a lower low in February, but the Stochastic formed a higher low.
In spite of the fact that divergence is not a timing indicator; it still gives a strong signal that a reversal can happen. Hence, although one should not trade just on divergence, it should prepare a trader in advance to use other tools like support/resistance, indicators and candlesticks to potentially look for a proper entry or exit point.
I found the technical analysis education series published by Investar, quite useful for the students of Technical Analysis .
I want to help new traders and students thro your education series .
Please help me with the total list of INVESTAR publication of these study materials .
Thank you for your kind words. All our webinars are listed in the education section of our website: http://www.investarindia.com/Webinar/default.aspx and our youtube channel: http://www.youtube.com/investarindia. If you still need help, you can email us at support@investarindia.com .
Do we have any ready scanner or can we create custom scanner for Divergences using investar?
We don’t have one right now, but it’s in our to-do list…Thank you for your feedback!