Are you interested in technical analysis and trading? Do you want to learn more about Moving Averages Strategies? You’ve come to the right place! In this blog post, we will explore the fascinating world of moving averages and how they can be used to enhance your trading decisions. Whether you’re a beginner or an experienced trader, this article will provide valuable insights into the power of moving averages.
Introduction to Moving Averages
Moving averages are one of the most widely used technical indicators in the world of trading. They help smooth out price data and identify trends by calculating the average price over a specific period. Moving averages are versatile tools that can be applied to various timeframes, making them suitable for day traders, swing traders, and long-term investors alike.
Golden Cross: Riding the Bullish Wave
The Golden Cross is a popular moving average strategy that signals a bullish trend reversal. It occurs when a short-term moving average crosses above a long-term moving average. Typically, traders use the 50-day and 200-day moving averages to identify this powerful buy signal. The Golden Cross suggests that the stock’s price is gaining momentum and could experience significant upward movement.
Example: BSE Limited – Daily Time Frame:
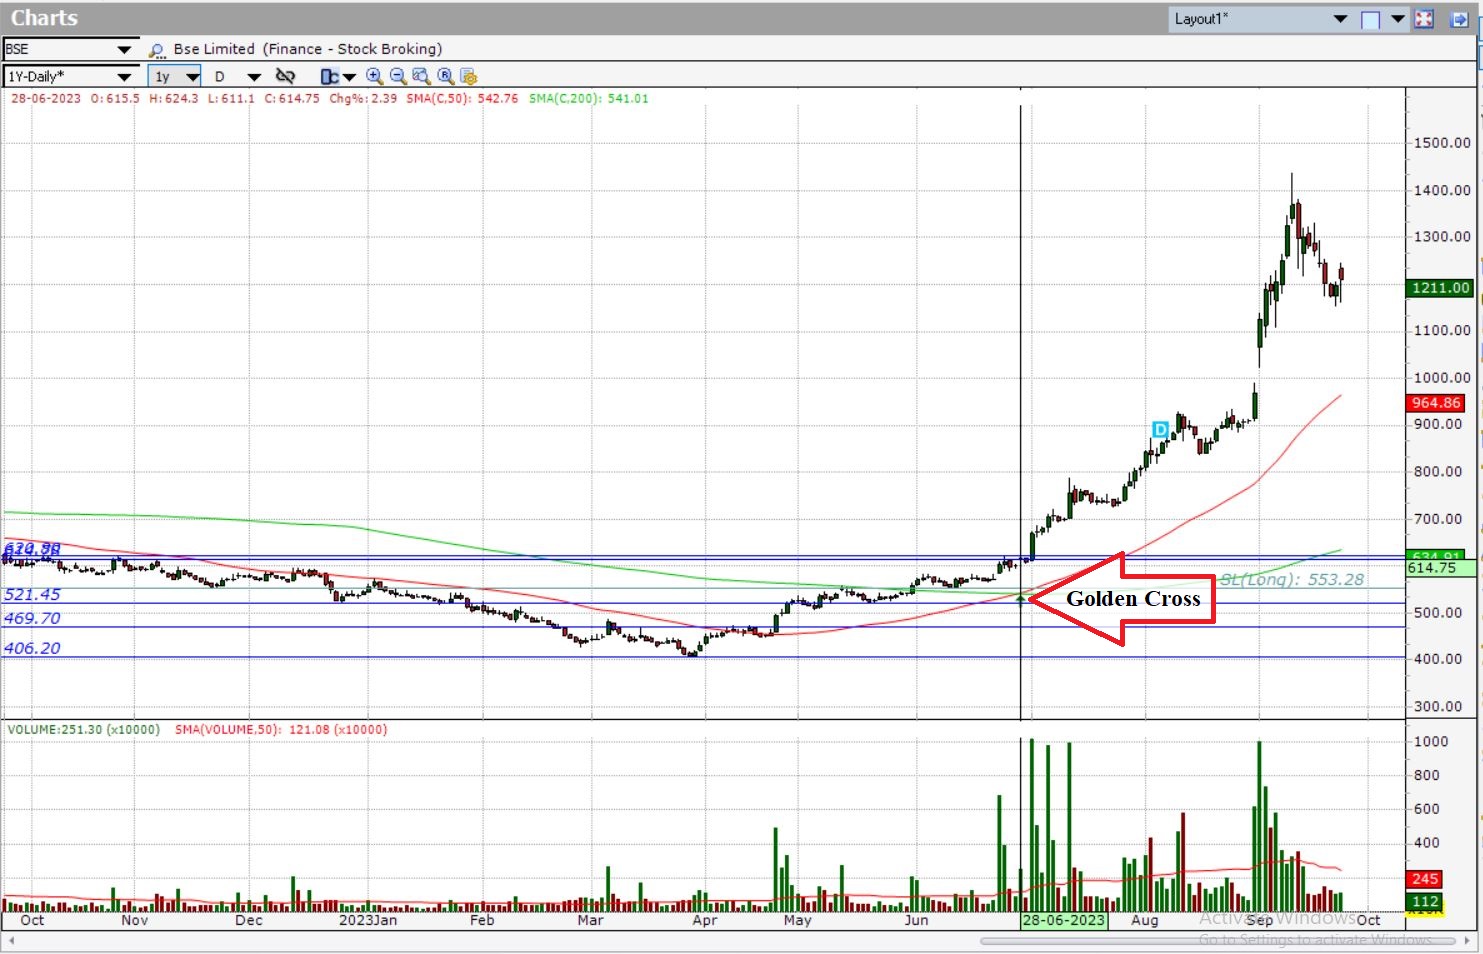
Here’s how you can take advantage of the Golden Cross strategy:
- Identify the Golden Cross: Monitor the 50-day and 200-day moving averages on your preferred charting platform. When the 50-day moving average crosses above the 200-day moving average, it’s time to consider entering a long position.
- Confirm with Volume: Volume is an essential factor in technical analysis. To validate the Golden Cross signal, look for an increase in trading volume as the crossover occurs. Higher volume indicates stronger market participation and reinforces the bullish sentiment.
- Set Stop-Loss and Take-Profit Levels: As with any trading strategy, risk management is crucial. Determine your stop-loss level to limit potential losses if the trade goes against you. Additionally, set a take-profit level to secure profits once the stock reaches your target price.
Remember, no strategy is foolproof, and it’s essential to conduct thorough research and practice proper risk management when implementing the Golden Cross strategy.
Death Cross: Navigating Bearish Waters
On the flip side, we have the Death Cross, which signals a bearish trend reversal. It occurs when a short-term moving average crosses below a long-term moving average. Traders often use the 50-day and 200-day moving averages to identify this sell signal. The Death Cross suggests that the stock’s price is losing momentum and could experience significant downward movement.
Example: Asian Paints Ltd – Daily Time Frame:
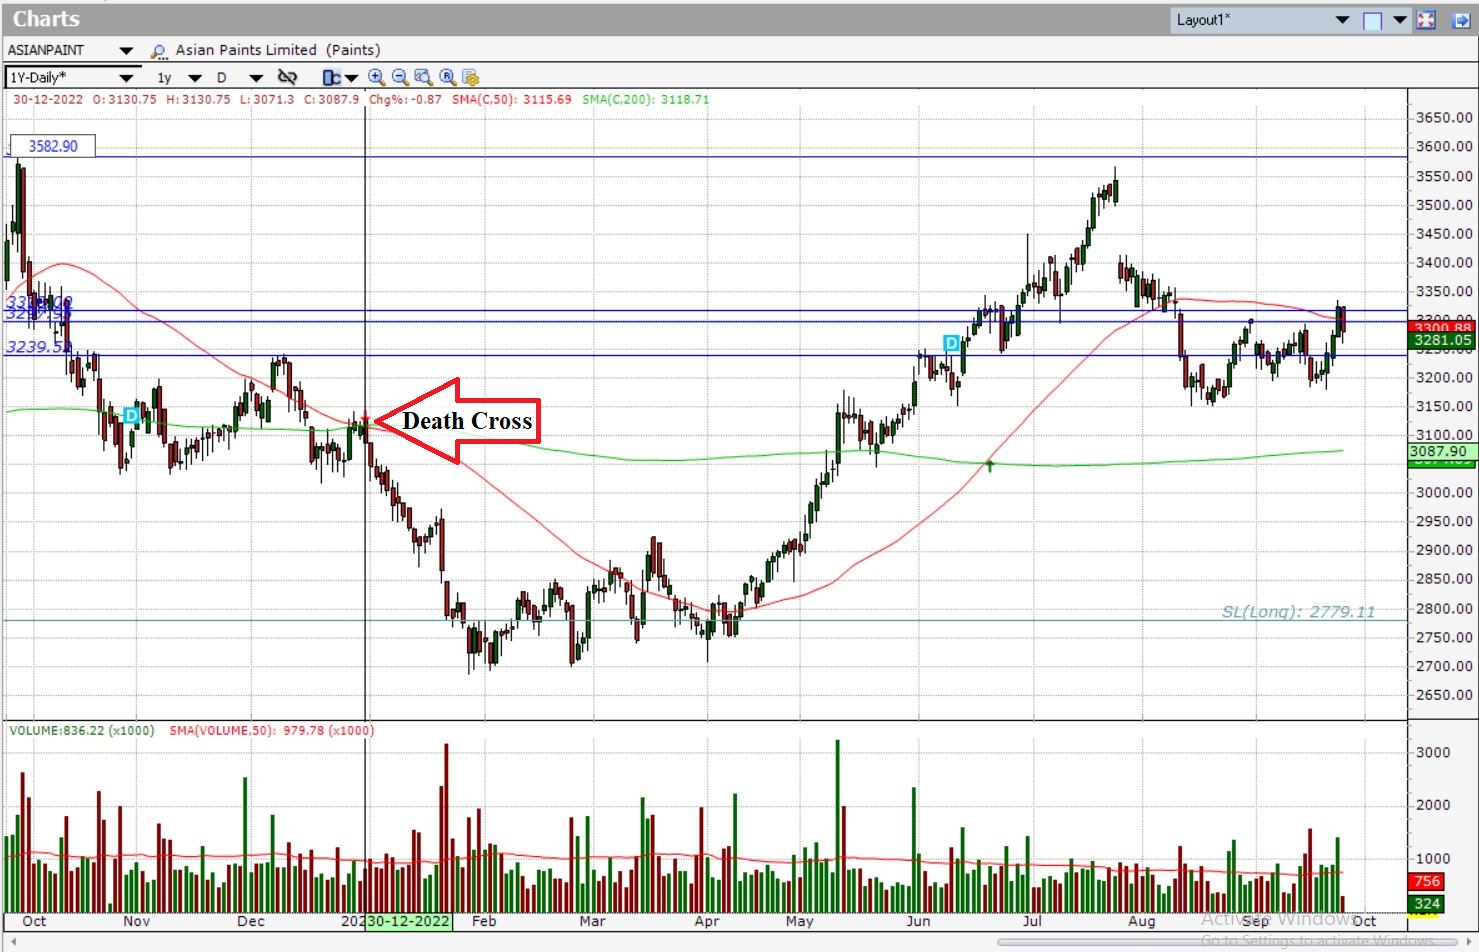
Here’s how you can navigate bearish waters using the Death Cross strategy:
- Spotting the Death Cross: Keep an eye on the 50-day and 200-day moving averages on your preferred charting platform. When the 50-day moving average crosses below the 200-day moving average, it’s time to consider entering a short position or tightening your stop-loss levels if you’re already short.
- Confirm with Volume: Similar to the Golden Cross strategy, volume plays a crucial role in validating Death Cross signals. Look for an increase in trading volume as the crossover occurs. Higher volume confirms market participation and strengthens the bearish sentiment.
- Implement Risk Management: As always, protect your capital by implementing appropriate risk management techniques. Determine your stop-loss level to limit potential losses if the trade goes against you. Additionally, set a take-profit level to secure profits once the stock reaches your target price.
Remember that trading involves risks, and it’s important to exercise caution when implementing any strategy.
Other Moving Averages Strategies:
Apart from the Golden Cross and Death Cross, there are additional moving averages strategies that traders can explore to enhance their trading decisions. These strategies utilize different combinations of moving averages to generate signals. Here are a few worth mentioning:
1. Moving Average Crossover:
- In this strategy, traders select multiple moving averages with different timeframes.
- When a shorter-term moving average crosses above a longer-term moving average, it generates a buy signal.
- Conversely, when a shorter-term moving average crosses below a longer-term moving average, it generates a sell signal.
- The number of moving averages and their timeframes depend on individual preferences and trading style.
2. Moving Average Ribbon:
- The Moving Average Ribbon strategy involves plotting multiple moving averages simultaneously.
- These moving averages are plotted on the chart, forming a “ribbon” that visually represents the trend.
- Traders look for a cluster of moving averages aligned in a particular direction to confirm a trend.
- This strategy can help traders identify strong and sustained trends in the market.
3. Moving Average Bounce:
- This strategy involves using moving averages as support or resistance levels.
- Traders identify specific moving averages that have historically acted as support or resistance for a stock.
- When the stock price approaches these moving averages, traders assess the potential for a bounce or reversal.
- It provides traders with entry or exit points based on the stock’s interaction with the moving averages.
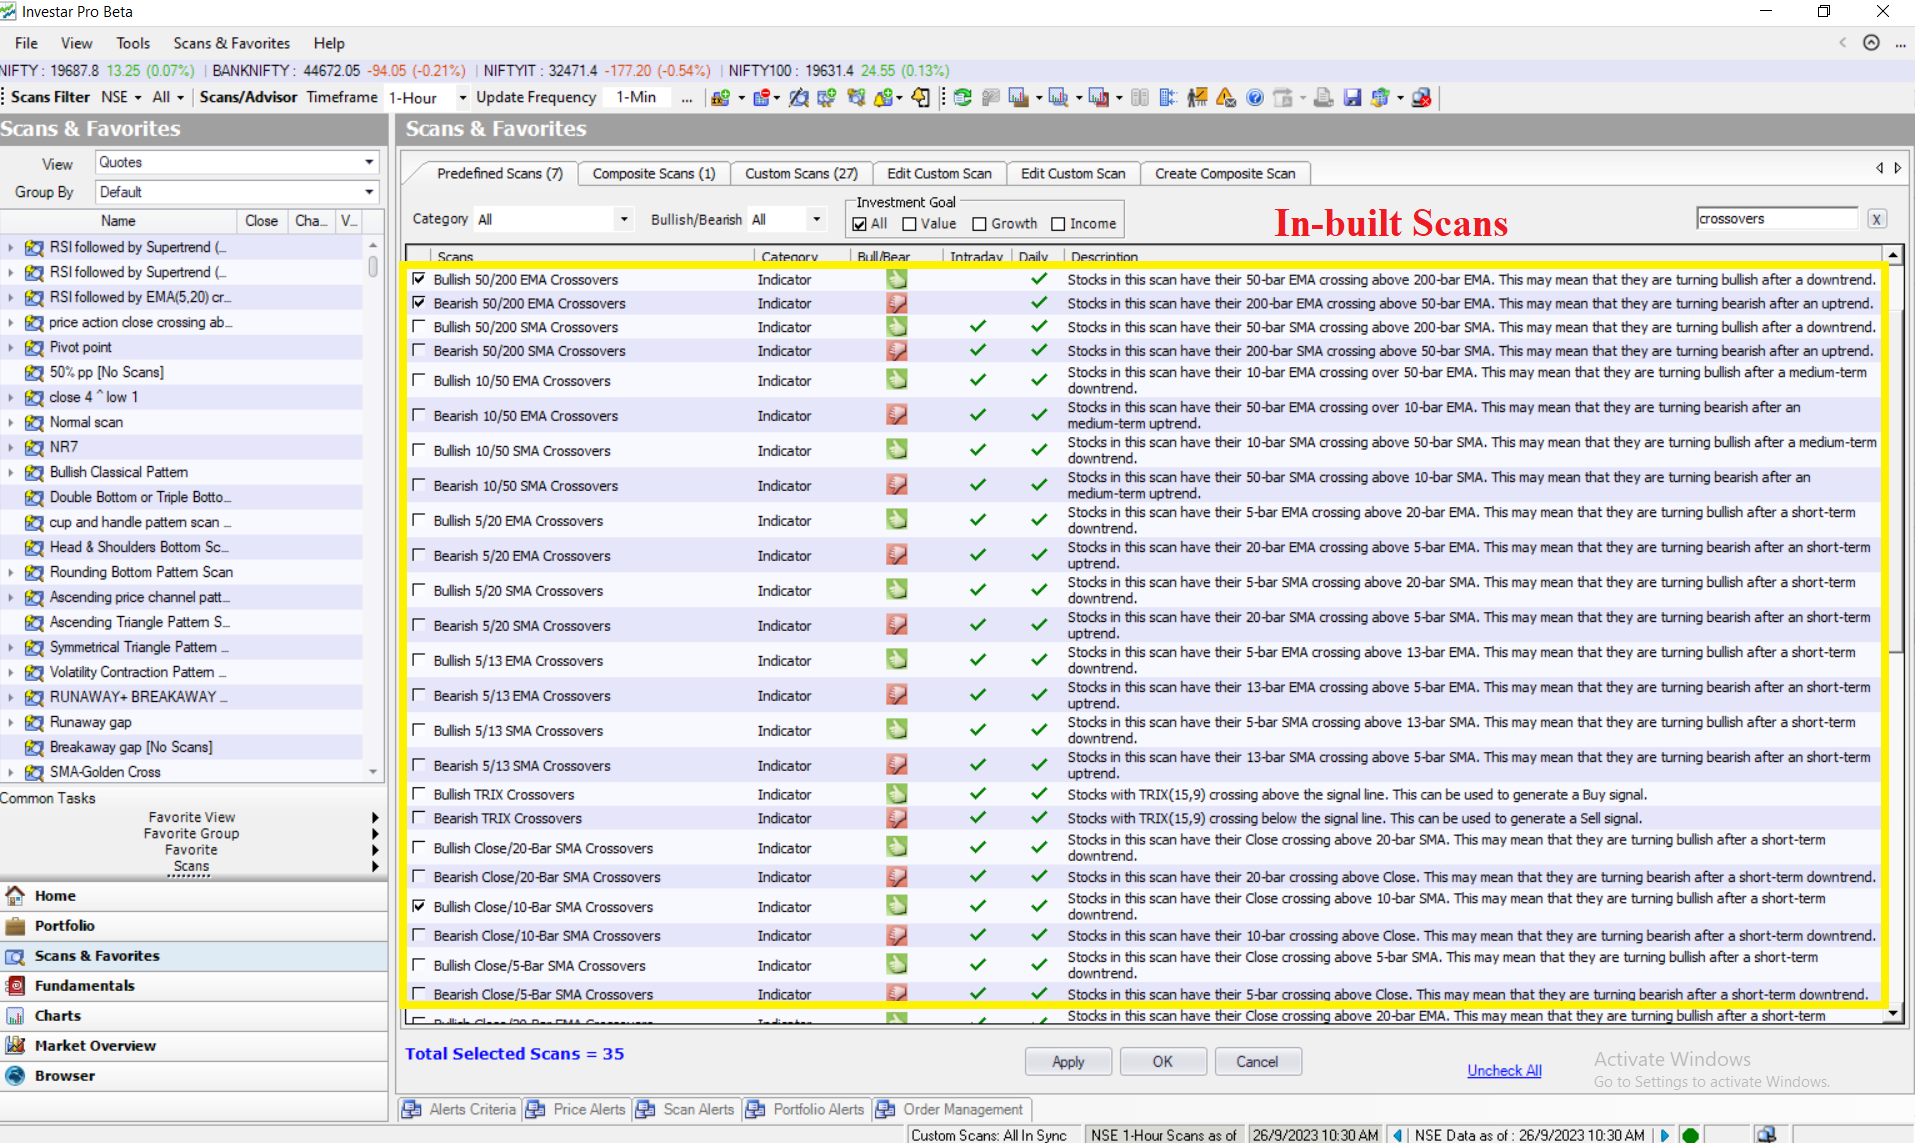
Moving Averages Scans
To simplify the process of applying moving averages strategies, traders can leverage the in-built scans provided by Investar, a powerful and user-friendly Technical Analysis Software. Investar offers a range of scanning options, including moving average scans, to help identify potential trading opportunities.
Conclusion
Moving Average Strategies offer valuable insights into market trends and can significantly enhance your trading decisions. Whether you’re a beginner or an experienced trader, understanding these strategies will give you an edge in today’s dynamic markets.
The Golden Cross and Death Cross strategies serve as important indicators of bullish and bearish market movements. Additionally, there are other moving averages strategies, such as the Moving Average Crossover, Moving Average Ribbon, and Moving Average Bounce, that traders can explore to further refine their trading approach.
Very interested to learn and investar provide best opportunities.
Thanks