This article discusses the need for Auto-Support/Resistance and why it makes it incredibly easy for all those traders who want to use Support/Resistance strategies in their trading.
Support/Resistance is widely used by Technical Analysts as a way to enter and exit trades and set targets.
However, one disadvantage of using Support/Resistance was that it needed a lot more effort to draw the support resistance lines manually. Here is the rough process that a professional Technical Analyst uses:
- Support: Draw a line through as many lows as possible without it being violated (i.e. without a close below support).
- Resistance: Draw a line through as many highs as possible without it being violated (i.e. without a close above resistance).
- Support and Resistance: Since Support can become Resistance when broken and vice versa, draw as many lines that are using both the above principles (i.e. going through as many highs and lows as possible).
- Rate the strength of the lines based on the number of touches, recency and the length to decide which one to use in their trading.
The above process is described somewhat in one of our earlier blog posts on How to identify and use Support/Resistance Levels.
Because this process is cumbersome, this caused many traders to come up with simpler techniques like Pivot Points which did not work in a consistent manner across different stocks. For that matter, there are many other support/resistance strategies based on Gap-up/down, Fibonacci Retracements, New High/New Lows that have some limitation or the other. The drawbacks of each of them are described in this webinar. Moreover, in each of these cases, it is very hard to differentiate between the strength of different levels.
We at Investar have always been trying to improve on come up with ways to be able to use Support/Resistance in a much easy way (without all the manual effort). We have finally come up with a feature called Auto-Support/Resistance that simplifies exactly the process of doing support/resistance analysis just as an expert Technical Analyst would.
Auto-Support/Resistance uses Artificial Intelligence to automatically plot the support/resistance levels on visiting a chart and rate them based on the strength of different levels based on the following factors that professional technical analysts use:
- How many touches does the support/resistance line have – the more the touches, the stronger it is.
- What is the recency of the touches – the more recent the touches, the stronger it is.
- How long is the resistance/support line – the longer the length, the stronger it is.
This feature will also allow a lot other benefits in a very easy manner. e.g., you can now do the following:
- Identify targets on any stock (nearest resistance or support based on Auto-SR).
- Decide to take a trade based on a favorable Risk/Reward ratio.Read more about Risk/Reward Ratio.
- Scan for resistance breakouts (used to identify volume breakouts) or support breakdowns.
- Scan for stocks with High Risk/Reward ratio.
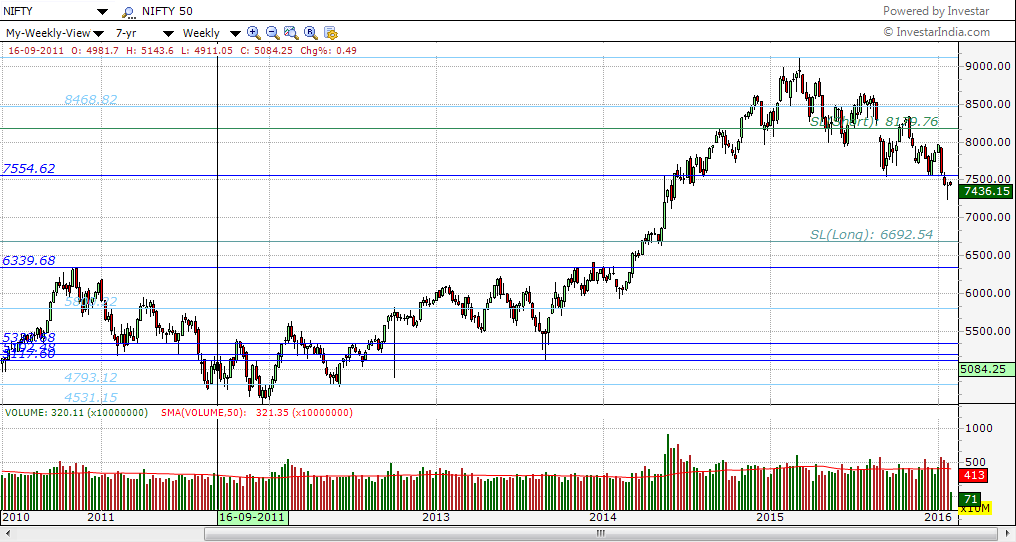
Here is a current weekly Nifty chart showing the long-term resistance of 6339 automatically predicted using Auto-SR. As you might, know, the break of this resistance is what started the one-year bull market from Mar 2014 to Mar 2015 that we had blogged about earlier when we did not have Auto-Support/Resistance!

Nifty Weekly chart with Auto-Support/Resistance showing the all-time long-term resistance of 6339 being broken indicating a start of a new uptrend
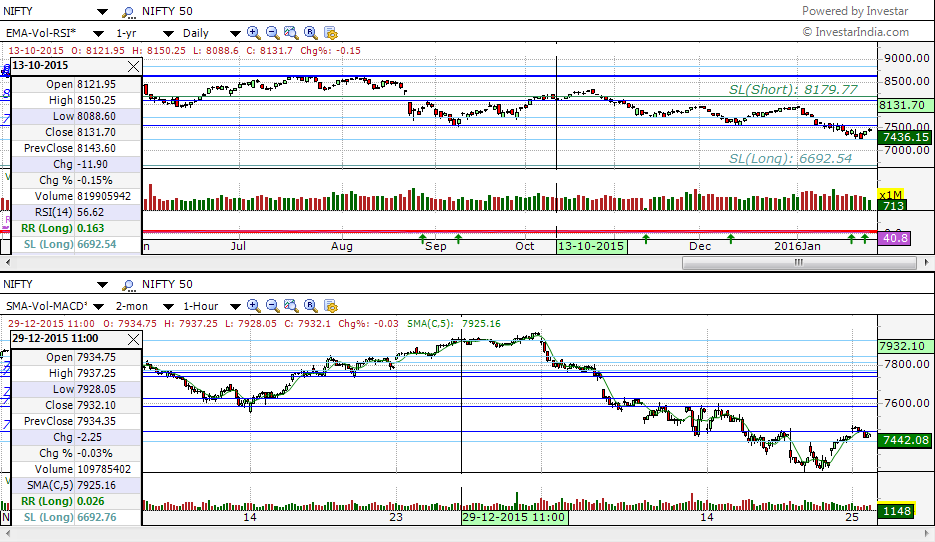
Here is a current Nifty Daily and hourly chart showing some of key Auto-SR levels – dark blue are the very strong levels (top 20%ile), and light blue are the strong levels (next 20%ile):
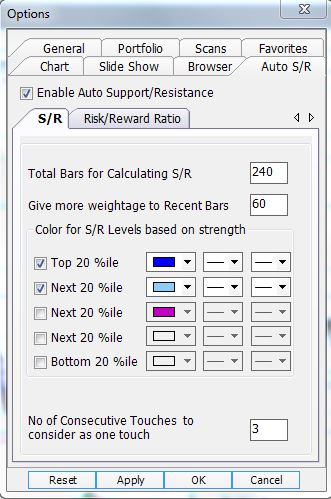
The Auto-Support/Resistance can be configured with the following options available in Tools->Options->Auto-SR:
Over the next few days we will be posting a lot more information on Auto-Support/Resistance. Stay tuned!


Options Dialog box – Auto S/R – S/R setting –
1) If I change No of consecutive touches to consider as one touch from default value of 3 to say4 or 6 or 20 or 99 there is no change in the S/R lines drawn in the chart. It is not working at all.
2) Give more weightage to recent bars – changing from default 60 to higher numbers say 100 or 200 has no impact on the S/R lines drawn … it is not working.
Risk reward ratio dialog box –
1) User should have the ability to set ones Stop loss %. Now it is limited to 2 % for intraday. Upto 5 to 10 % for short term etc. Pl allow the user to have his own % stops.
2) The stop loss lines are calculated based on the latest price. So the stop loss line keeps changing both up and down. This makes the feature useless.
I would like to keep the stop loss fixed, from the price I bought the stock.
Example I bought a stock at 100. Applying Stop loss of 5 % = 95. This should be fixed. The line should not change after that.
You may even consider trailing stop loss. By trailing the line upwards for “Buy” and trailing downwards for “Sell”, with a 5% difference.
Current form of stop loss is just not useful.