Double Top and Double Bottom Patterns are powerful reversal patterns that indicate potential reversals from a prior trend.
What is Double Bottom Pattern ?
A Double Bottom Pattern is a Classical Chart Pattern which indicates a possible bottom after a downtrend. It is one of the patterns in Technical Analysis with a very high success ratio of above 70%.
The double bottom pattern looks like the letter “W”, where the price drops to a low then rebounds, then again drops to the same low and again rebounds. Hence it is also commonly referred to as the “W” pattern. The twice-touched low is considered a support level. A trader would enter a stock at the breakout of the high of the double bottom pattern, which is like a resistance (also called a neckline).
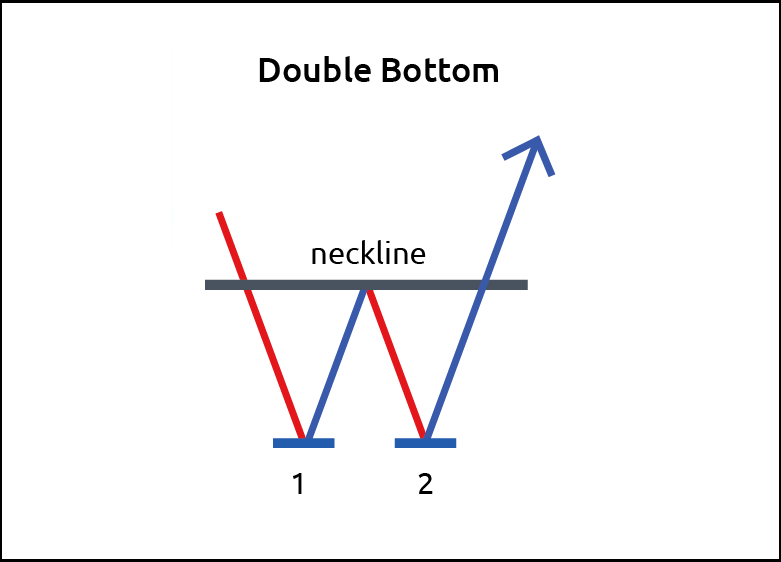
The high success rate of the pattern comes from the fact that the high and low of the pattern have been tested atleast two times.
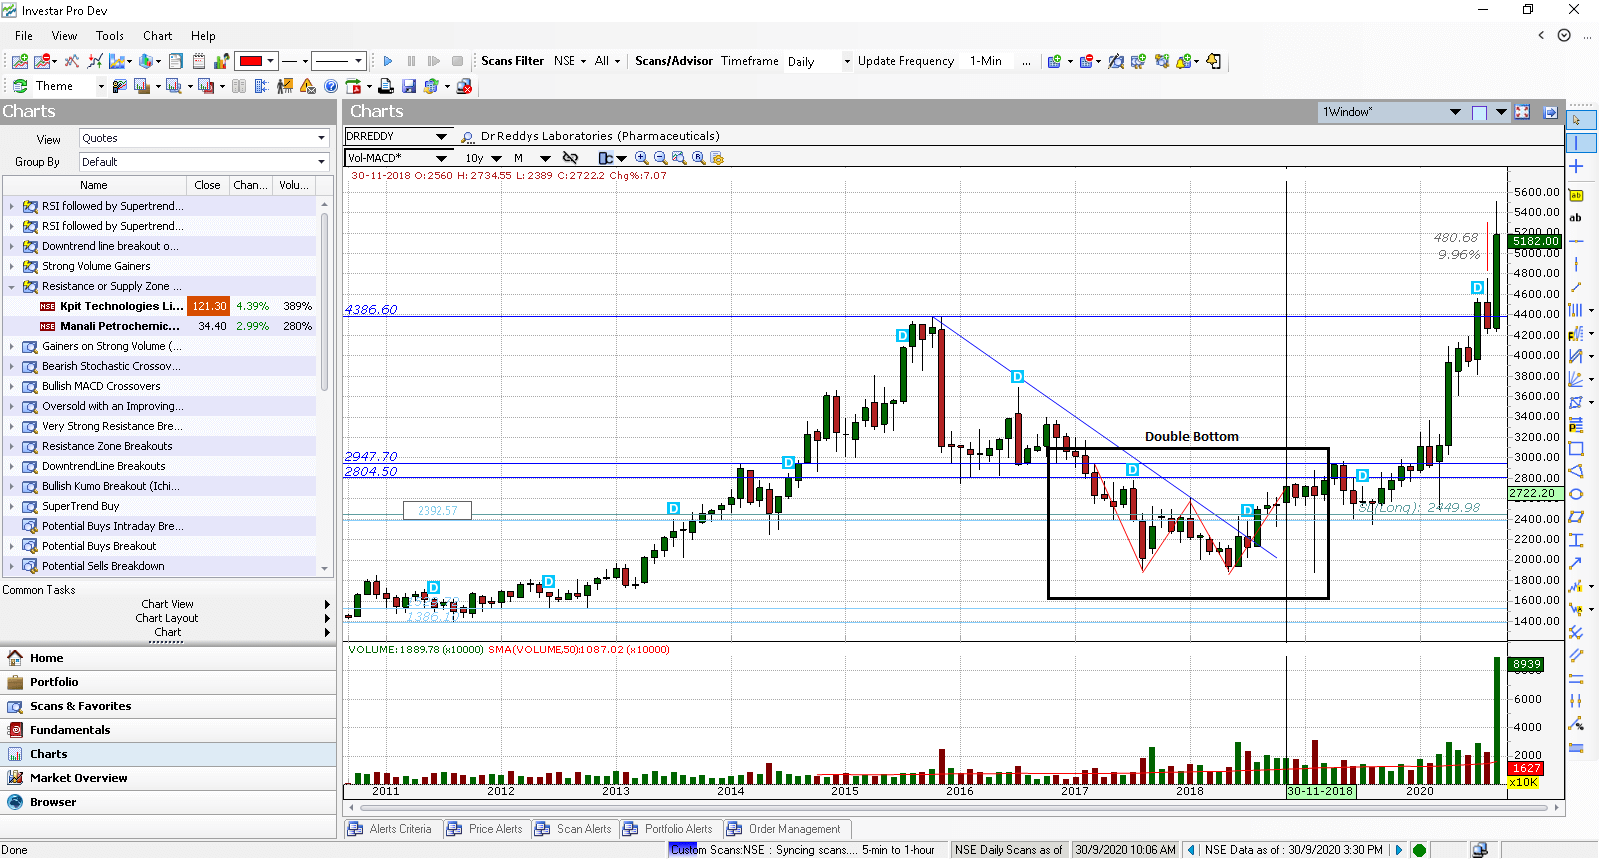
Double Bottom trading example
An example of a double bottom is shown in the Investar screenshot below.
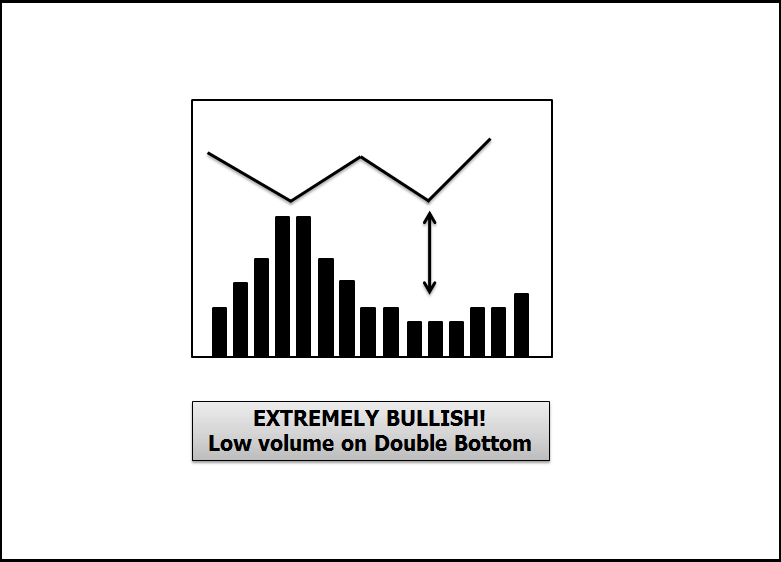
The breakout can be considered to have an even higher probability of success if during the drop to the 2nd low, the volume is below average as it indicates that all the weak holders are exiting, and hence the breakout that follows will be even more stronger.
What is Double Top Pattern?
A Double Top Pattern is a Classical Chart Pattern which indicates a possible top after an uptrend.
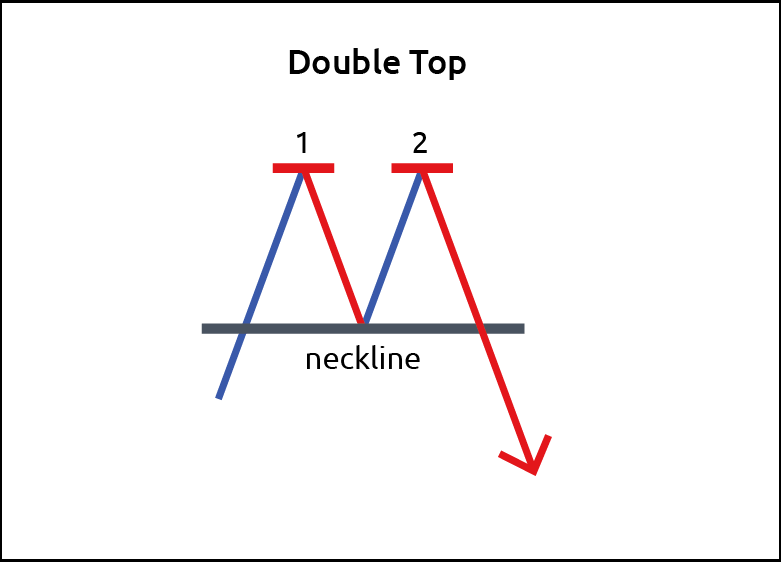
The double top pattern looks like the letter “M”, where the price makes a high then drops to a low, then again tests the same high and again drops to the low. Hence it is also commonly referred to as the “M” pattern. The twice-touched high is considered a resistance level (also called a neckline). A trader would sell/short-sell a stock at the breakdown of the low of the double top pattern, which is like a support.
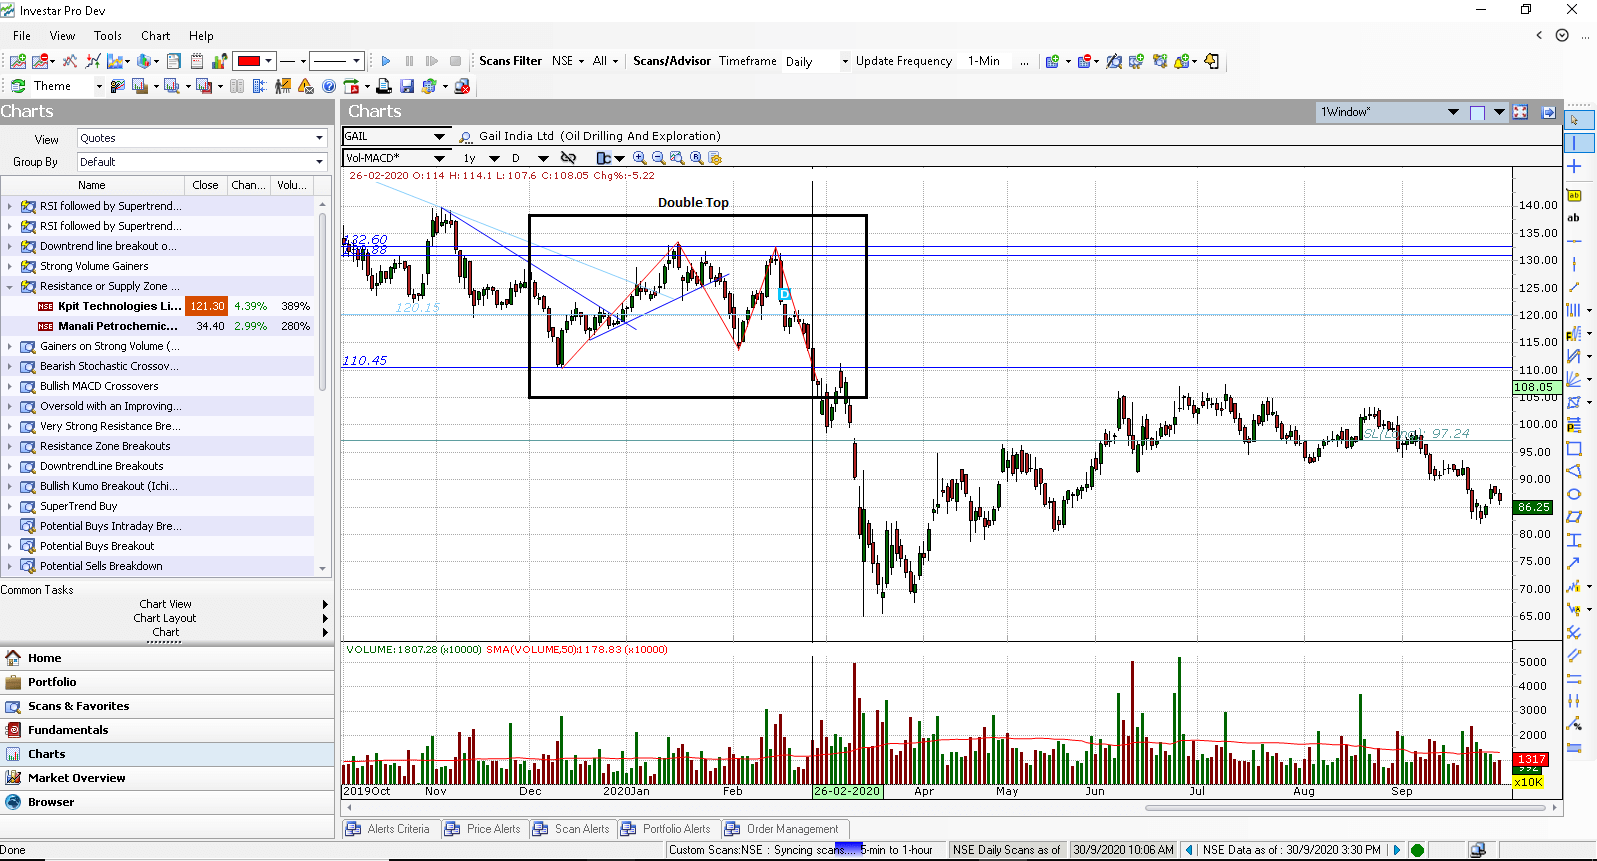
Double top trading example
An example of a double top is shown in the Investar screenshot below.
Double Top and Double Bottom Patterns are extremely reliable patterns which work better in longer timeframe charts like Daily and higher timeframes compared to intraday timeframes. By adopting these tools in your trading arsenal, you can improve the effectiveness of your trading. At times, you can find these patterns easily by simply enabling Auto-Support/Resistance in Investar, which can help you spot these patterns easily.
For more details, check out our video on “Auto-Classical Patterns” for an in-depth look into this topic :
nice article
Thanks
Hello
Very nice topic.
Can you please write code of those pattern in java script?
Thanks
Thanks
Sorry, we can’t write code. However, you can utilize our Auto Classical Patterns feature in our software to find any patterns.