We’ve got some good news for our Stock Screener users. Building custom screener queries can be intimidating and somewhat frustrating sometimes. So, in this tutorial, we are going to build upon the excellent quick screener queries with Investar to help you improve your trading strategies.
To demonstrate how screeners work, let’s look at some basic to complex examples:
Let’s choose a value of Close crossing below the value of Min (5) on current bar. Then our query will look something like this:
What does this above scan mean?
This scan will give stocks whose Close value of the current bar is crossing below the minimum of the previous 5 bar lows. This is often used by traders as a sell signal for shorting.
As you can see in the above chart the close value is 72.80 and it has crossed below the minimum of the 5 previous bar lows (73).
Likewise, a similar query based on the Max(7) of High would be used to find 7-bar high breakouts. As you can see, the Investar custom screener is both easy to use and powerful at the same time.
Let’s move forward and try to see a multiple line query related to Auto-Support/Resistance.
What does this above scan mean?
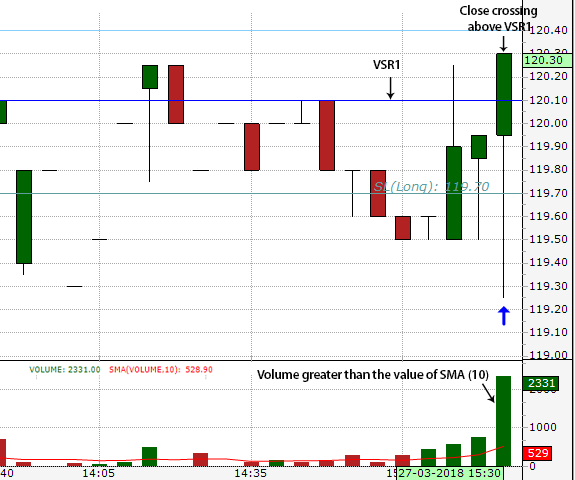
In Auto-Support/Resistance (Auto-SR), close should be crossing above the VSR1 (Very Strong Resistance) line (dark blue lines in Investar) and volume should be greater than the average volume (i.e SMA (10) of the volume in the last 3 bars including a current bar.

In the above figure, we can clearly see that the close of current bar is crossing above the VSR1 and at the same time satisfying the other condition i.e., a value of volume is greater than the value of SMA (10)
In the above figure, we can clearly see that the close of current bar is crossing above the VSR1 and at the same time satisfying the other volume conditions
Now, look at another bearish query.
What does the above scan mean?
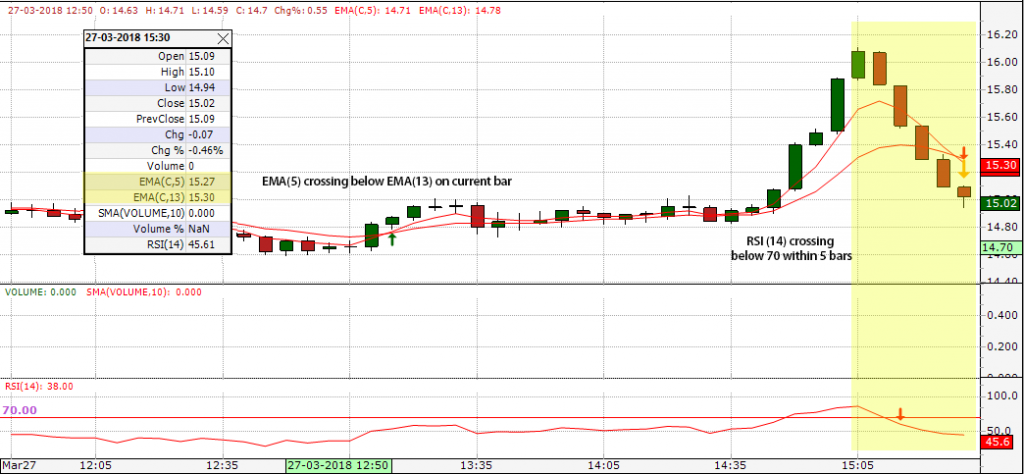
RSI (14) should cross below the value of (70) within 5 bars and value of EMA(5) close should cross below a value of EMA(13) on its current bar.
In the above figure, you can clearly see that sell signal is formed when RSI(14) crossed below the value of 70 within 5 bars followed by EMA(5) (15.27) crossing below the value of EMA(13) (15.30) on its current bar.
We hope this post has given you some new ideas on creating and testing your own customs scans. Which indicators to use in the custom scan is up to you. Try as many as you can. That is the only way to get the best one for your trading style and your ease of use requirements.
We highly recommend you to please go through our Custom Screener video for better understanding.
Happy Learning 🙂


Please provide some more sample queries for better understading.
Please call our support team they will help you 🙂