Today is the day! We are pleased to announce a new release of Investar Beta. This latest update in our continuous innovation stream delivers many new features and enhancements.
The Investar platform always tries to offer a good amount of customization which traders can use to their benefit.
What’s New?
Exclusion of Scan Timeframes
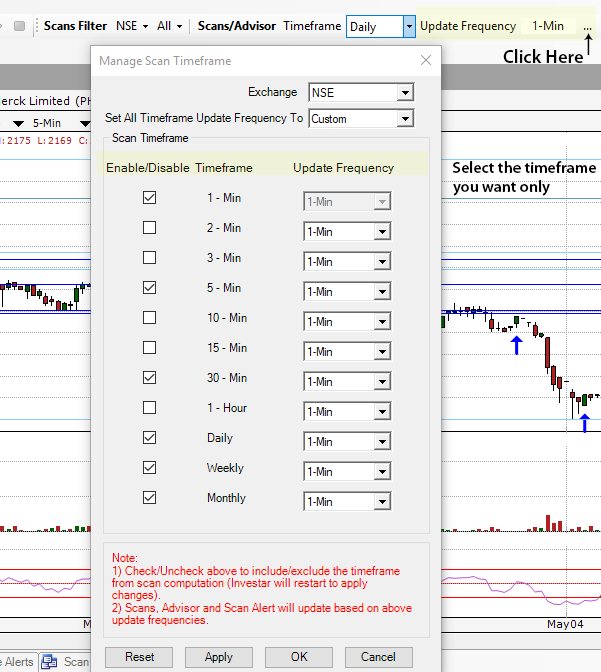
As per customer feedback, we have added an ability to exclude custom scan time-frames from the computation for reduced RAM consumption and improved stability of the software.
While Investar platform offers a good selection of custom time frames, starting from 1-minute and up to monthly, every trader/investor usually uses only 2 or 3 of them. For example, a day trader may use only 3-min and 15-min scan timeframes, while a swing trader may use Daily and Hourly timeframe charts. So now in Beta, you can customize your time frames with ease.
To access the new time menu, just
- Click on the “..” button beside update frequency in the Scans toolbar.
- Uncheck the timeframes that you are not interested.
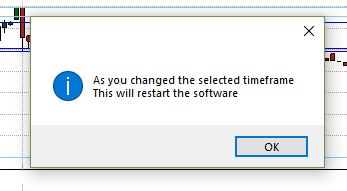
- After clicking on Apply button, a dialog box will be shown:
Click OK to restart the software.
- Now you should have the scan timeframes of your choice visible from the “Scans/Advisor Timeframe” drop-down menu.
- These scan timeframes are applicable to Custom Scans, Pre-defined Scans, and Composite Scans
Zoom-In/Zoom-Out
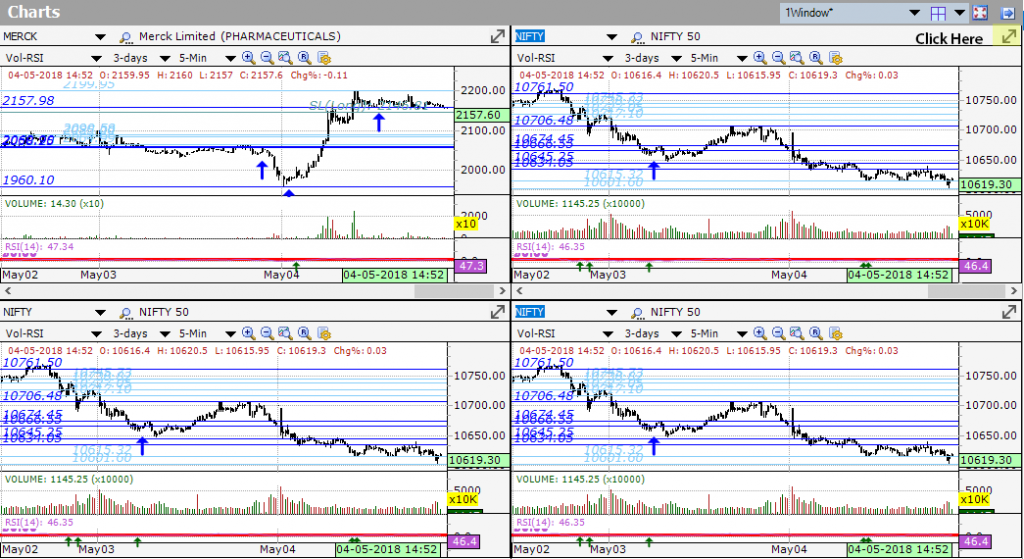
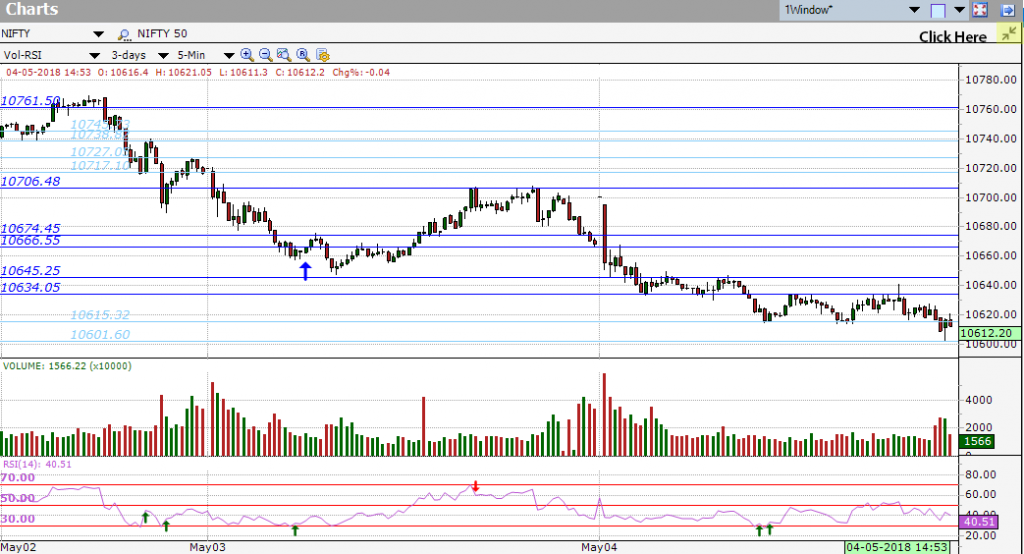
Now users can zoom in and out of the Specific chart. The specific chart can be seen in a full window by pressing ‘Z’ key from a keyboard or by clicking on ‘Maximize Chart’ button on the north-west corner. It can be restored back to the previous state by pressing ‘Z’ key again or by clicking the ‘Restore Chart‘ button.
Within N-bars
Within N-bars is now calculated for exactly N bars. I.e Within 2 bars will now imply total 2 bars- current bar and 1 bar back.
In the above figure, you can clearly see that buy signal is formed when RSI(14) crossed above the value of 30 within 2 bars followed by EMA(5) crossing below the value of EMA(20) on its current bar.
Some Other features such as:
-
- Supertrend and Bollinger Band now supports fractional parameters (so now you can create custom scans with Supertrend(5,1.5) and Bollinger Bands(10,1.9) )
-
- Support for VWAP indicator for a custom scan (only supported for intraday)
-
- Support for Pivot Points-based custom scans (in new Price Action category).
-
- Support for n% and n-times for Auto S/R and Price Action for a custom scan.
-
- New Candlestick pattern ‘Doji’.
-
- Display High/Low Values of Zig-Zag indicator on the chart.
-
- Functionality to enlarge a specific chart in multiple chart layout with Z key (or maximize button)
-
- Introduced a new custom scan category known as ‘Price Action’. We will be adding more interesting custom scans in the future like Gap Up/Down, Opening Range Breakout etc.
- Proper display to update scans group’s status in Favorites in error scenarios.
What are the new Changes in Beta?
-
- More precise custom scan status to let the user know the current state of a custom scan.
-
- Removed unnecessary computation of custom scans in off-market scenarios for better user experience.
-
- In Chart Comparison, the values for each symbol are now displayed in Data Window.
-
- Bollinger Bands indicator can be now drawn on the values of Open, High, Low, Close.
-
- Improved Visibility of Auto S/R Lines values (now displayed on mouse hover)
-
- Increased indicator support for n-times and n-% (e.g. n-times sma(10) of volume)
- “Un-Check All” in Manage Scans should only be applicable to scans in a visible tab.
Which bugs have been fixed in Beta?
-
- Sync scan time improved. Also helpful in case of accidental system shutdown.
-
- Computing time improved for newly added custom scan queries.
-
- Custom Scan query which contains Open Interest, was giving results in NSE exchange which is wrong.
- Improved performance of D-W-M custom scans.
How to get the new version?
Download Here
What’s more, Investar 5.5 and Investar Beta can run simultaneously, so it will not affect your normal usage.


Pls post video of how to create custom scan. Then execution of customs scan with results. Otherwise very difficult to use customs scan.
Sir,
please go to this link: http://www.investarindia.com/blog/custom-screener-user-guide-investar-users (This blog include both article and a video explaining how to use custom Screener) and another link: http://www.investarindia.com/blog/building-custom-screener-queries
Was going through the post, and I got confused on Price Action strategy, can you please explain what this is and how can it be used for trading.
Price Action Strategy is a trading strategy that is totally based on Open, High, Low and Close. We will have a detailed follow-up post regarding the same. Also, our custom screener will cover a lot more price action based stragegies in the future like NR4, NR7 and Open Range Breakout. Stay tuned!