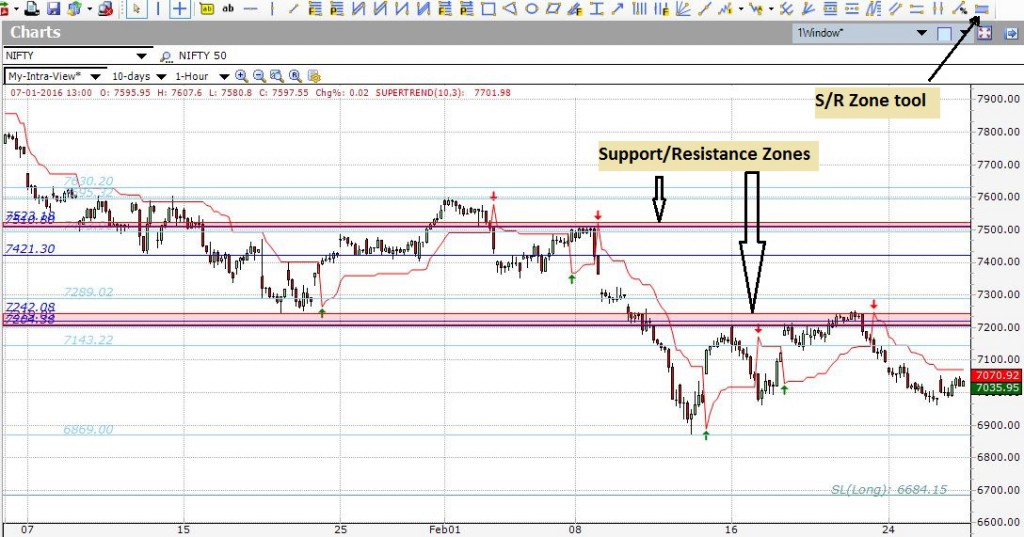
Support/Resistance breakouts are used by traders as buy/sell signals. However, often times a stock breaking out of a resistance or support line can lead to false breakouts. One situation this can occur is if too many resistance or support lines are very close together. When this happens, it is best to club nearby lines and treat them as a support or resistance zone rather than trade them separately.
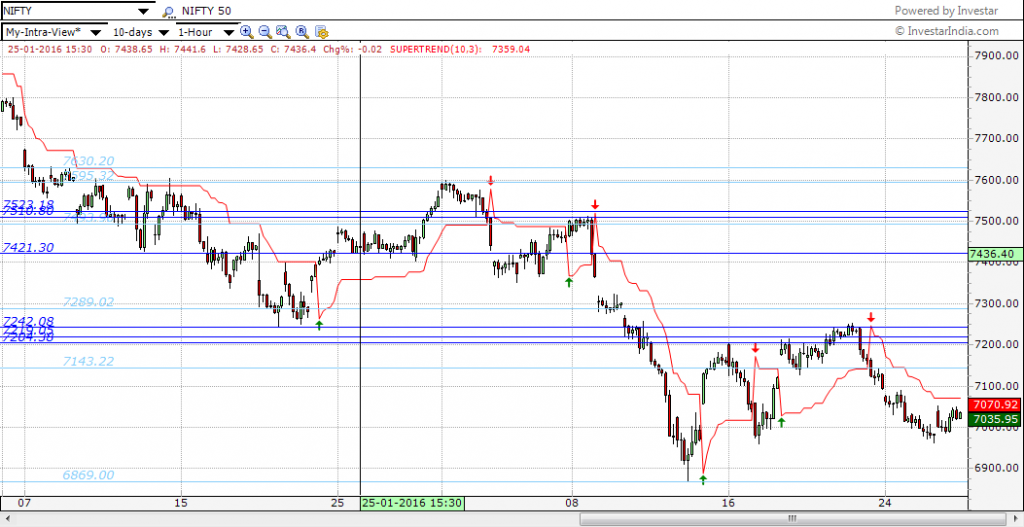
Support/Resistance zones or Supply/Demand zones are formed by clubbing together nearby support/resistance lines. What one considers “nearby” can vary from trader to trader. To see how this is done, enable Auto-Support/Resistance in Investar (only available with the Auto-Support/Resistance addon) by clicking on the right-click button and then “Enable Auto-Support/Resistance”. A screenshot of a Nifty 1-hour chart with Auto-SR enabled is shown below.
In the above chart, Nifty has a resistance at 7208, but as we can see, even if it were to break it, there is an immediate resistance of 7242. Since any decision taken using just 7208 might be premature, it makes sense to wait for 7242 to be broken before deciding to go long on Nifty. Hence we treat the entire range from 7208 to 7242 range as a resistance zone and color it red as shown in the Nifty hourly chart below. Here we have marked the area between the two lines as a red zone – using the “S/R zone” tool in Investar.
So, how do we use S/R zones for trading? Here are some simple rules to use S/R zones in your trading improve your accuracy.
Using S/R zones for buying/selling on breakouts/breakdowns:
Buying on resistance breakouts: Buy only if stock goes above upper resistance in a resistance zone.
Selling on support breakdowns: Sell only if the stock breaks down below lower support in a support zone.
Since resistance and support are also used for setting targets, you can also set targets using support/resistance zones as follows:
Long target (i.e. Buy): Use the lower resistance line in the resistance zone as a target.
Short target (i.e. Short Sell): Use the upper support line in a support zone as a target.
Following the above rules with Support/Resistance zones can greatly improve the accuracy in your trading.


Next expo?in which city?
I have seen auto-support / resistance as also pivot lines generated in the software.
There are three add-ons or rather all add-ons for intraday like Screeners or intraday timeframe charts for which it should be available for free or rather be part of those.
Secondly, the software should be programmed to calculate Pivot Lines and Auto Support / Resistance levels based on at least 30 minute time frame 9 30 minutes tack) to be more useful for intra day traders. Otherwise it remains constant for the entire day based on previous days parameters.
Thanks and regards.