What is VWAP Indicator?
Volume-weighted average price (VWAP) is the average price weighted by volume.
Institutions often base VWAP on every single tick of data that occurs during the trading day. Calculating VWAP based on other time frames, such as 1-minute or 5-minute price bars is also acceptable, and is how most chart platforms like Investar plot it. Volume-weighted average price (VWAP) is calculated using the following steps:
- Pick what period you’ll use as your input, 1-minute price bars, 5-minute price bars, etc.
- For each bar take the High + Low + Close and divide by 3. This gives you a “typical” price for that period.
- Multiply the typical price of that period by the volume for that period, to get the Weighted Price.
- Keep a running total of the Weighted Price, as well as a running total of volume as new data becomes available (a period ends). These are called Cumulative (or Total) Weighted Price and Cumulative Volume respectively.
- To get the VWAP, divide the Cumulative Weighted Price by Cumulative Volume.
How to use VWAP Indicator?
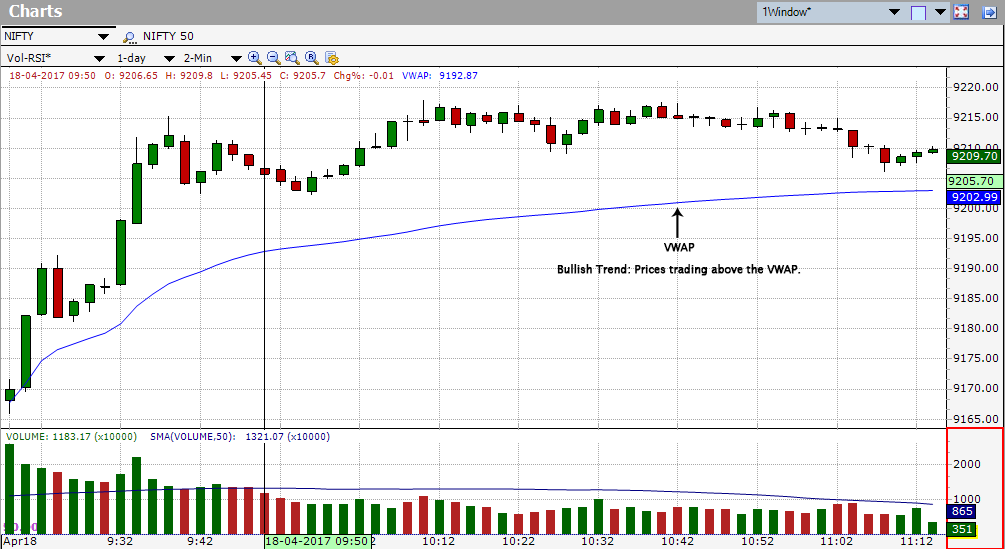
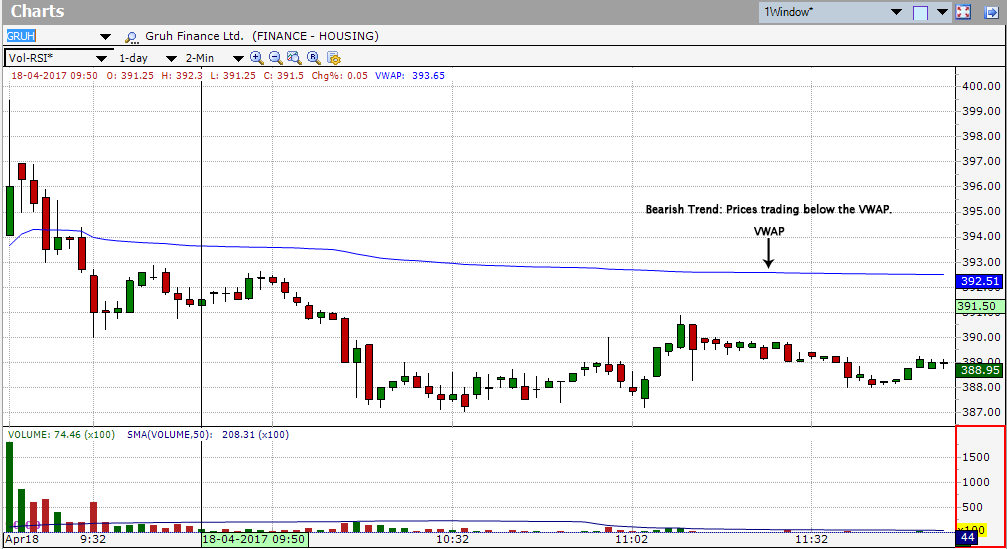
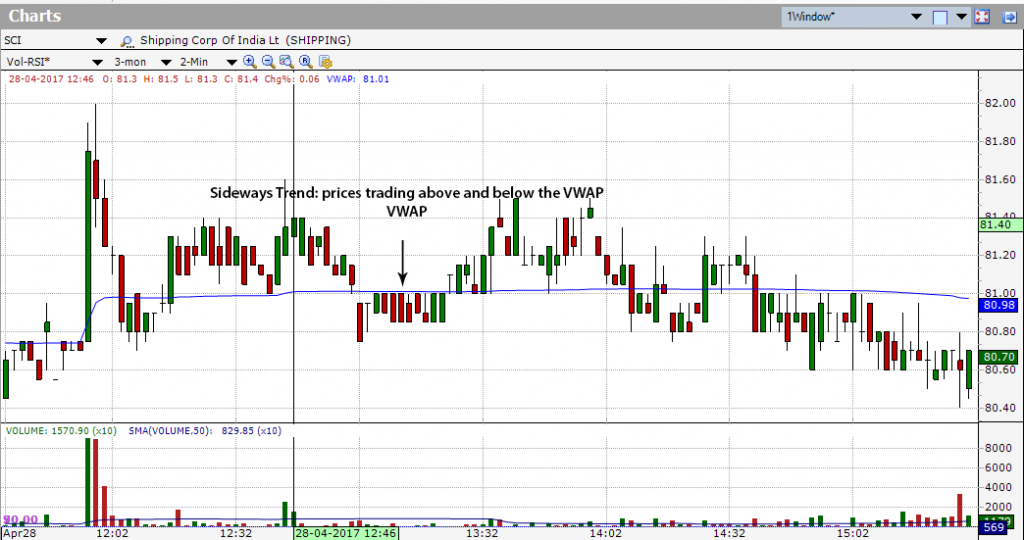
VWAP resembles a moving average, where prices above the VWAP indicate a bullish trend and prices below the VWAP indicate a bearish trend. VWAP is generally used by technical analysts to identify market trend. When price and VWAP cross each other many times, the trend is usually sideways. The screenshots below show examples of bullish, bearish and sideways trend.
When the price is below the plotted VWAP values, the trend is going down, or there is a downward bias to the trading day. Institutional buyers thinking of buying tend to buy when the price is below VWAP, as they are in a position to accumulate a position at a better price as compared to normal (VWAP) price.
Short-term traders generally do the contrary, interpreting the price below the VWAP as bearish, as well as seeking short positions.
When the price is above the plotted VWAP, the trend is probably going up. Institutional buyers trying to sell or short will often attempt to sell when the price is above VWAP, as they are in a position to accumulate a short position. Short-term traders generally do the opposite, interpreting the price above the VWAP as bullish, and look for long positions.
Volume-weighted average price (VWAP) is an aid and a reason for price information that lowers market noise. It does not provide entry signals, stop loss levels or target prices.
VWAP can also experience lag. VWAP lags price simply because it is an average depending on past data. The more data there is, the greater the lag. For example, when you are using a 1 minute chart, after five hours of trading, VWAP has been computed for 300 intervals. The lag related to this would be similar to a 300 period moving average.
The Volume Weighted Average Price (VWAP) is an appealing indicator because unlike various other technical analysis tools, it is best suited for intraday analysis. VWAP is a great technical indicator simply because it represents both price AND volume. VWAP doesn’t provide trade signals like many other indicators; it’s an analysis and benchmarking tool. As the day progresses the VWAP begins to lag more and more. Therefore, retail traders find it more beneficial early in the trading session, and institutional traders find it more beneficial toward the close.


why it is not plotted in daily charts..
VWAP by definition is an indicator which is applicable only for intraday. If you read this post carefully, it is calculated from 1-min or 5-min price and volume. Even the interpretation is useful for intraday only. Hence it is not plotted on daily chart.s