Investar 6 introduces exciting improvements and new features aimed at optimizing productivity and even better usability. We always keep adding new features to the Investar software to enhance your trading experience with our software.
What’s New in Investar 6?
Custom Screener
Now you can create your own custom scans with Investar. Custom Screener is a tool to help you scan stocks broken out of various technical levels or satisfying certain indicator criteria that you’ve customized and built during your experience with stock markets & technical analysis.
Our motto is to help the trader/investor to find new stock ideas in the market whether you are an intraday trader, short-term swing trader or long-term investor.
Auto-updating Scans
When you create a new custom scan, initial computation will take some time, but later, all the scans auto-update with the market (just like you are used to currently with the pre-defined scans).
Our goal is to give you a good enough understanding of the technology to fully leverage the possible advantages of technical analysis. The Investar Custom Screener allows the use of both IQL (Investar Query Language) and IEL (Investar Easy Language) in hybrid mode, IQL Only mode and IEL Only mode.
IEL (Investar Easy Language)
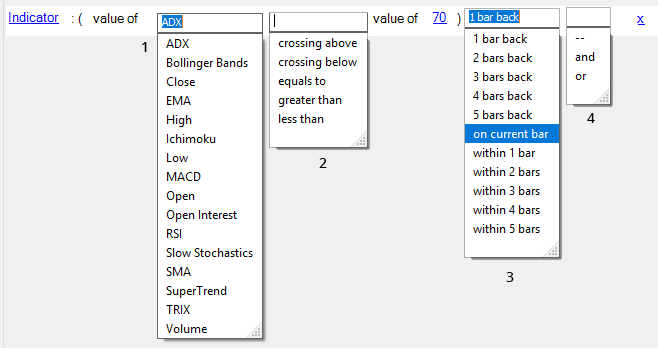
In this mode, you can actually write easy to understand English-language queries. It provides user-friendly query completion to make it easy to define queries like below image:
Let’s try to understand a few terminologies here first:
N Bars Back means the condition will be satisfied only on the nth bar (with respect to the current bar).
E.g. “2 bars back” means the condition will be satisfied exactly 2 bars back.
Within n bars means the bar including a current bar.
E.g. “within 3 bars” means the condition is satisfied anywhere during the last 3 bars including the current bar.
For n bars means the condition is satisfied for n bars including a current bar.
E.g. “for 3 bars” means the condition is satisfied for all the last 3 bars including the current bar.
IQL (Investar Query Language)
IQL (Investar Query Language) provides a simple and user-friendly medium to enable the users to use the inbuilt indicators, candlesticks, price action, and many other technical analysis tools by minimal coding. IQL is easy to pick up for those who are familiar with the C-language.
IQL and IEL mode
On clicking the “Manage Scans -> Custom Scans -> Create Custom Scan” you will be displayed a GUI for creating custom scans which use the Investar Easy Language (IEL). See the figure below. The window will also have a toggle switch which can be used to simply move to IQL editor, to see the equivalent representation in IQL. You can also add pure IQL sub-queries by using an “IQL” variable (e.g. IQL0 in the below figure).
The example below defines an Auto-Support/Resistance based volume breakout where the current candle is not a boring candle. This can be easily done in IEL-IQL Hybrid mode in the following steps:
- Switch to IEL Mode.
- Define the Auto-SR breakout (in Auto-SR category).
- Define criteria for above average volume
- Add an IQL sub-category. Click on IQL0 link to switch to IQL mode and complete the RHS to get the expression for IQL0. This allows to define a mathematical operation on the OHLC of the current candle, which defines a candle that is not a boring candle.
For more details, check out our video on “Introducing the Investar Query Language – IQL” on youtube for an in-depth look into this topic or you can also read here.
Custom Scan based Buy/Sell Signals in a chart
We have introduced a facility to create your own custom scans. Now, you can also specify the buy/sell signals based on that.
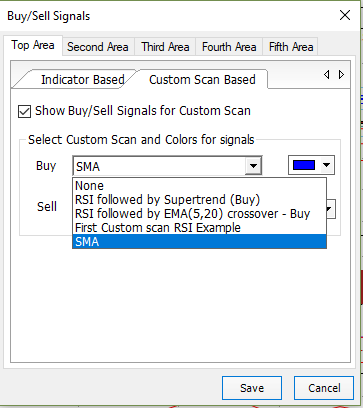
To see Buy/Sell signals for Custom screener all you have to do is Select Buy/Sell Signal from toolbar menu and select “Custom Scan Based” Tab.
Now click on the Save button.
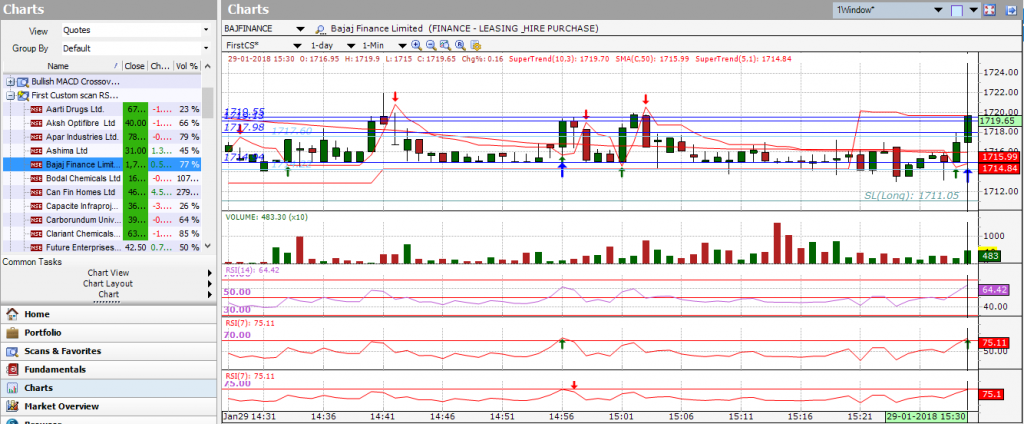
The blue arrow indicates the Buy signals for the custom scan for which the Buy signal was set. You can also change the color of Buy/Sell signals.
Heiken-Ashi scans
Heikin-Ashi scans are now available in Investar 6.0. It can be added for Intraday, daily, weekly & monthly ranges.
HeikenAshi scans use Heikin-Ashi candles instead of normal Japanese candlestick candles for all the scans. We are supporting it in two categories: candlestick and limited indicators (RSI, MACD, SUPT, EMA, ADX, ATR, CO, EMA on RSI, FI, PPO, TRIX, VROC).
Now, if you want to get Heikin-Ashi scan, you just have to tick the box of “HA” next to the indicator category and then you will be able to get your scan for the Heikin-Ashi candles.
Support for Auto S/R Zones in chart and custom screener
We made something that no one has made in charts to date (as far as we know).
We have added a new feature “Auto-SR Zone Detection” widely also known as “Auto Supply-Demand Zone Detection”.
Supply-Demand Zones (or Support-Resistance Zones or SR Zones for short) are areas of supply/demand created in the chart. Nearby Support/Resistance lines can be clubbed together to create a Support/Resistance zone. Using S/R zones instead of S/R lines can improve the accuracy of trading immensely as it can help you to avoid false buy/sell signals as well as give better targets and stop losses.
Support for Auto Trendline in Chart and Custom Screener
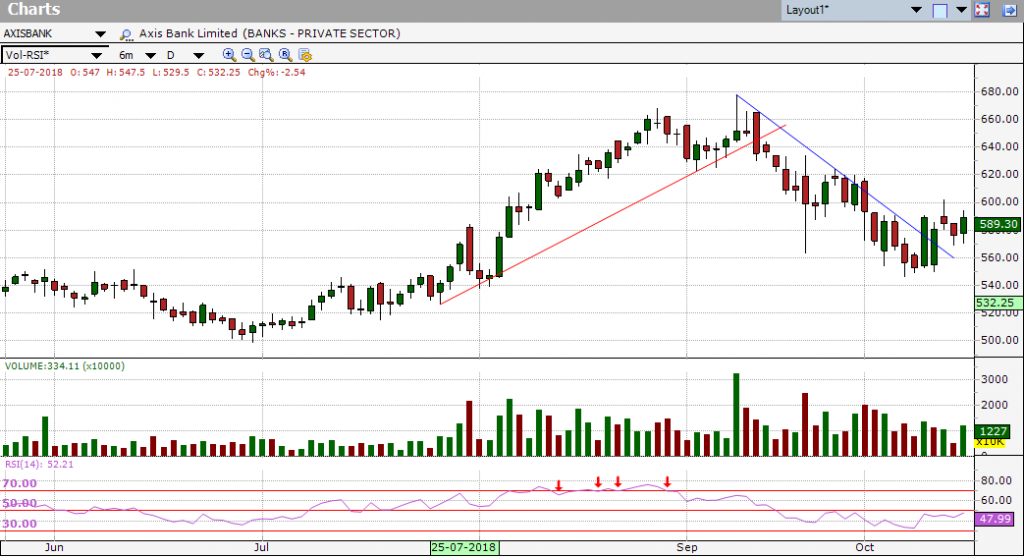
The auto-trend line feature determines the current uptrend and downtrend line and draws them.
Trend lines may also be drawn manually using the drawing tool on the charting toolbar, but with our new Auto Trendline feature, it not only does it automatically but also colors the trend lines based on strength (blue for strong, red for not so strong).
Multiple Timeframe custom scans and scan alerts
Now you can create Multiple Timeframe custom scans. In the interface, you’ll see a basic screen with the default example of custom scans. The blue colored texts composed of fields allowing you to choose a ratio or metric and compare it with a value.
Now, if you want to scan for the particular timeframe you just have to tick the box of “Multi-Timeframe query” and then you will be able to set your scan for a particular timeframe.
Custom Timeframes
You can now add custom timeframes to the software. Simply do the following:
- Select Tools->Options from the main menu
- Select the Data tab
- Enter a Custom Timeframe and then click Add button. The timeframe will be added throughout the software (e.g. in charts, custom scans and scan alerts).
- If you check the “Align candle grouping to market hours”, then the candles will be aligned to market hours. (e.g. for Hourly timeframe, first candle will be 9:15 am to 10:15 am instead of 9:15 am to 10:00 am, if this option is not checked.
For more details, see this video below:
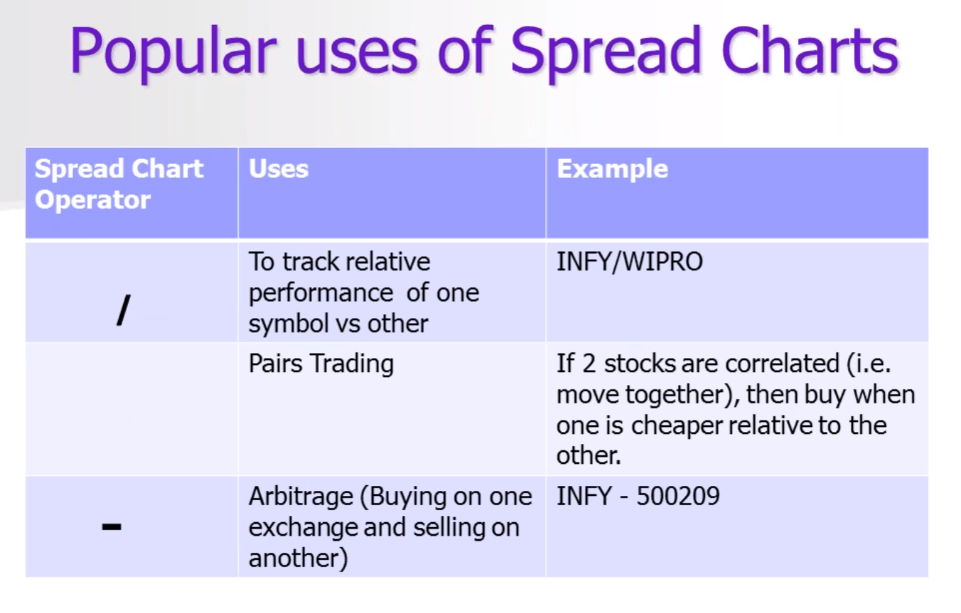
Spread Charts
Trading using spreads has been gaining in popularity because they provide a new perspective of a financial instrument’s value and can also help to alleviate some risk.
To view a spread chart in Investar charts, enter the first symbol; next enter an operator (/) for division (+) for addition (*) for multiplication and (/) for division and then the next symbol.
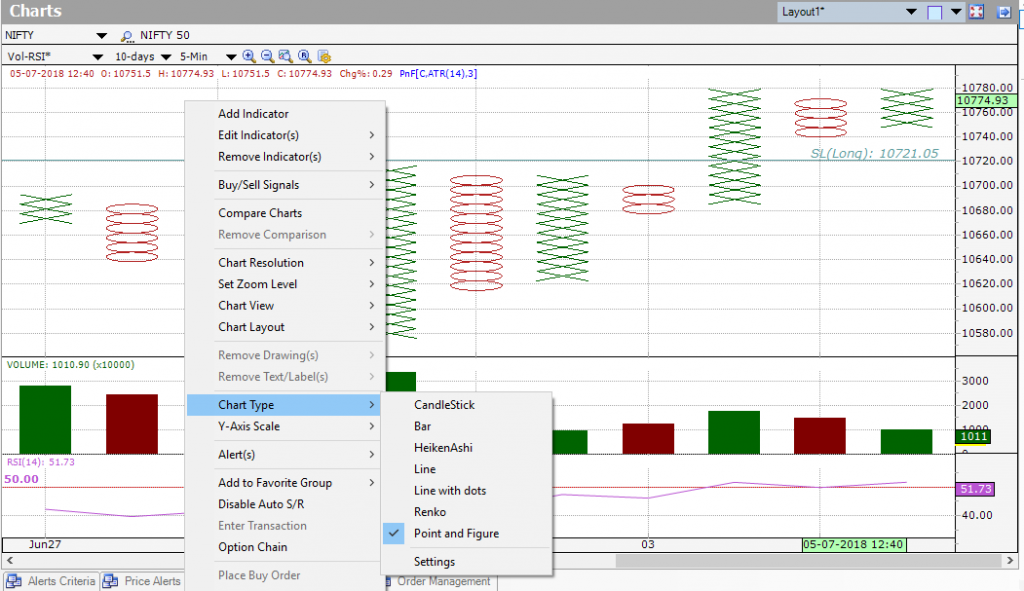
Point And Figure charts
Point and figure charts can be a useful way to help you identify broad price trends. Point-and-figure is not very well known or used by the average investor, but they have a long history of use dating back to the first technical traders. These simple charts only focus on the significant price moves, while filtering out ‘noise’.
Scan Alert Notifications on Mobile (Supported for Investar Mobile Release and Beta)
You can now get Investar Desktop scans notifications on your Phone. You could just sync your notifications to your Mobile, so they show up right there—which really makes a lot more sense.
Select Set Scan Alert Notifications on Mobile from the Standard Toolbar and set alerts on symbols for which you want an alert. You can add as many alerts as you want to set.
A notification should show up on your mobile. Boom, you’re done there.
Some Other features such as:
- Option to align candles to market hours in chart and custom scan.
- Introducing new drawings: i) Gann Square, ii) Gann Box, iii) ABCD harmonic pattern, iv) XABCD harmonic pattern.
- Support of Awesome Oscillator, ATP, Delivery Volume Percentage, Delivery Volume, Chandelier Exit and Vortex indicator in chart.
- Added option “Move Favorite group” in Favorite Tree
- Multi-select functionality in favorites.
- Preservation of Lookup settings for F&Os
- And many more…
What’s more, Investar 6.0 and Investar Beta can run simultaneously, so it will not affect your normal usage.
