Pivot Points are theoretical support and resistance levels based on the previous day’s open, high, low and close values: PP,R1,R2,R3,S1,S2,S3. PP is the Pivot Point, R1,R2,R3 are resistance levels, and S1,S2 and S3 are support levels. They are only valid as support and resistance levels for intraday trading. Pivot Levels can be calculated based on Classic, Camarilla or Woodie based formulae.
In general, the accuracy of Pivot Points is not as high as hand-drawn support/resistance levels. The reason is very simple: When you hand-draw support/resistance levels (Support Levels are drawn through lows in the price chart and Resistance Levels are drawn through highs in the price chart), these are real areas of buying and selling pressure and hence the chances of success are pretty high, especially for the strong support and resistance levels (Determining strength of support/resistance/trendlines is given a lot of coverage in our “Basics of Technical Analysis” webinar).
Nonetheless, Pivot Levels do work on some charts especially in the scrips that are widely followed, e.g. Nifty. But, it is always a good practice to test them on a stock or index before you actually trade based on them. But how do you trade based on Pivot Levels?
One way traders use pivot levels is as follows:
If the stock opens above PP, it indicates a bullish bias and if it opens below PP, it indicates a bearish bias. If the stock opens above PP and crosses R1, then one can buy with the target set as R2. If the stock opens below PP and crosses S1, then one can short with the target set as S2. The key thing to remember though is that these are purely intraday levels and change every day when there are new closing prices for the day.
If you are using the Investar software, you can get the Pivot Point levels based on any of the formulae. The default formula can be set by going to Tools->Options and then set the “default Pivot Point formula” in theGeneral Tab.
How does Investar help you if you trade based on Pivot-based points?
Firstly, the Investar screener can help you identify opportunities based on Pivot-Points by identifying the following scans:
- Scans for finding stocks with Bullish and Bearish bias: “Close above PP” and “Close below PP“.
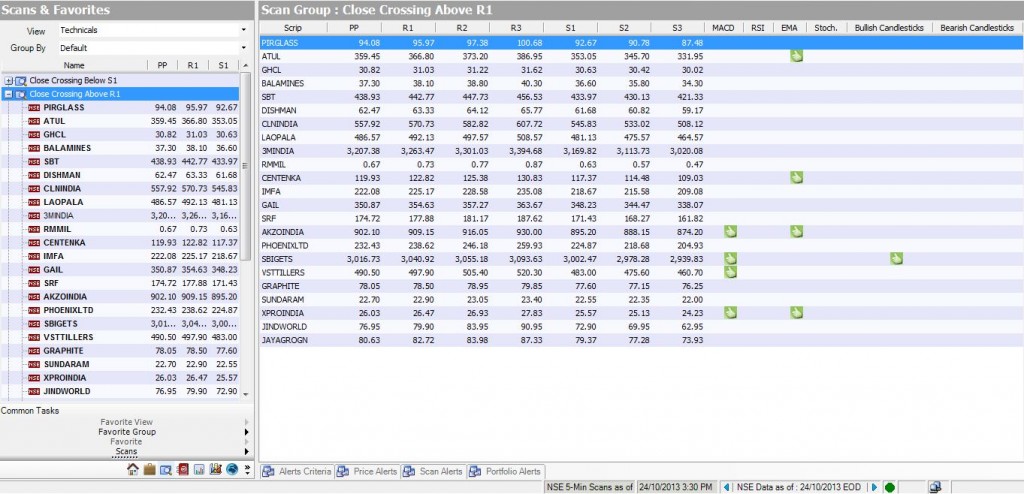
- Scans for finding stocks crossing R1 and S1: “Close crossing above R1” and “Close crossing below S1“.
Secondly, if you have a list of stocks or futures and want to see all the Pivot Levels in one screen you can use the “Technical View” in Investar to see all Pivot Levels in one handy screen.
Both the above are demonstrated in the Investar screenshot below.
