Average Directional Index or ADX is an oscillator that is used to determine the strength of a trend. It is a good indicator that gives a confirmation of trend. Since, trend is an important concept in Technical Analysis, it can be a good indicator in any Technical Analyst’s arsenal.
The value of ADX fluctuates between 0 and 100. If only ADX is used, then its interpretation is as follows.
| ADX Value | Interpretation |
| Below 20 | A weak trend or non-trending |
| Crosses above 20 | Trend may be emerging |
| Between 20 and 40 | Increasing ADX is a confirmation of trend |
| Above 40 | Very strong trend in place |
| Crosses below 40 | Signals end of trend |
As you can see in the table above, ADX by itself does not give any indication of the direction of the trend. In order to get an idea about the direction of the trend, we need to use two sister indicators along with ADX, +DI and -DI.
When +DI is above -DI, an uptrend is said to be in place, provided the ADX is above 20 and rising.
When -DI is above +DI, a downtrend is said to be in place, provided the ADX is above 20 and rising.
Based on the above, there are generally two ways to use ADX, +DI and -DI (each of them have a corresponding scan in Investar).
Strategy 1:
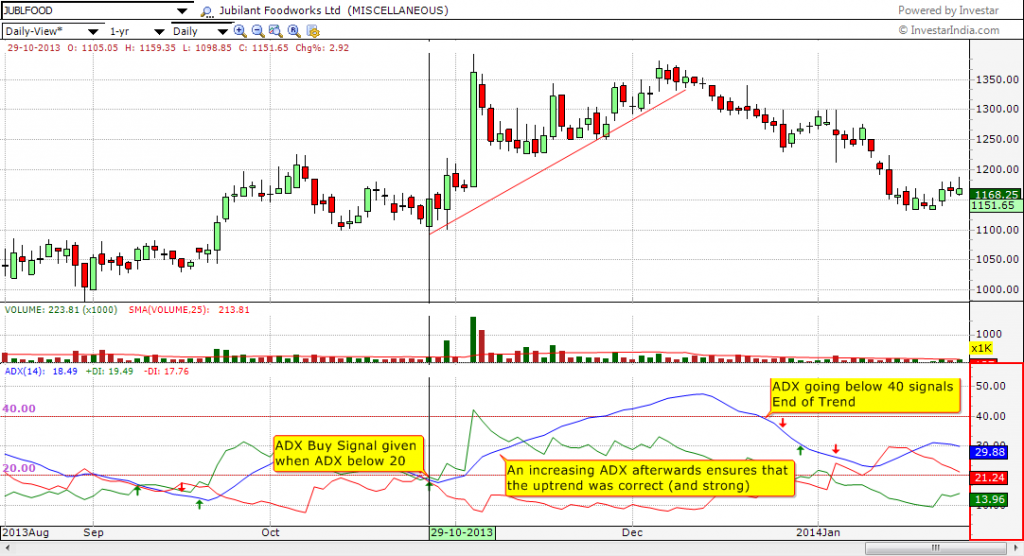
When +DI crosses above -DI, it indicates a start of an uptrend (in other words, generates a Buy signal). When -DI crosses above +DI, it indicates a start of a downtrend (in other words, it generates a Sell signal). To reduce the possibility of false signals in this case, it is a good idea to ensure that ADX is above 20 and rising when or after the crossover takes place. The scans in Investar corresponding to this strategy are “New Uptrend (+DI/-DI Crossovers)” and “New Downtrend (+DI/-DI Crossovers)“. This is the more popular strategy and also the default way the Buy/Sell signals are generated in Investar using ADX and an example is shown in the Figure below. As the figure below shows, however, sometimes the when the +DI/-DI Crossovers happen, the ADX can be below 20, its a good practice to ensure that the ADX is rising afterwards to ensure that you don’t get trapped in a false signal.
Strategy 2:
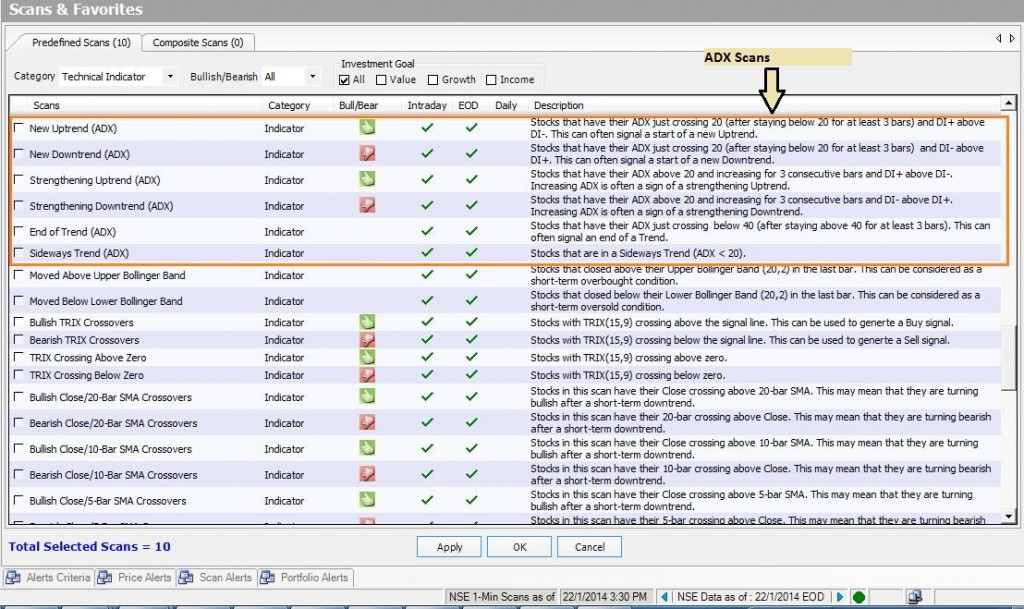
In this strategy, a Buy signal is generated when ADX crosses above 20 and +DI is above -DI. A Sell signal is generated when ADX crosses above 20 and -DI is above +DI. The scans in Investar corresponding to this strategy are “New Uptrend (ADX)” and “New Downtrend (ADX)“.
There are many other scans in Investar that give you stocks in various stages of their trend and they are shown in the figure below.
Strategy 1 is the more common way to use ADX for entry and exits. Using only DI+/DI- crossovers generates many false signals and ensuring that ADX is above 20 can reduce the false signals, but as the example chart of JUBLFOOD above showed, it can sometimes also eliminate the correct signals. If you want to use +DI/-DI crossover even when the ADX is below 20, a good practice would be to ensure that the trend is rising afterwards.
However, ADX along with +DI/-DI crossovers is not a perfect indicator and does give false signals. Hence it is important to remember that there is no substitute for using proper trendlines to draw trend and use ADX (with +DI and -DI) for confirmation purposes only.


Good explanation
Clear & easy to understand…
Sir,
Good explanation about ADX.
But, How to use in renko chart with supertrand indicator? And what’s parameter and strategy for intraday call put nnifty trade?
Thanks for the feedback, we will consider it for a future blog post topic.
Good