Often times, I find traders use technical indicators and follow their Buy/Sell signals blindly, without really understanding how that indicator is to be used. One of the first thing you have to know when you use an indicator is to know what category it falls in. The majority of indicators out there are either the oscillating or trending type.
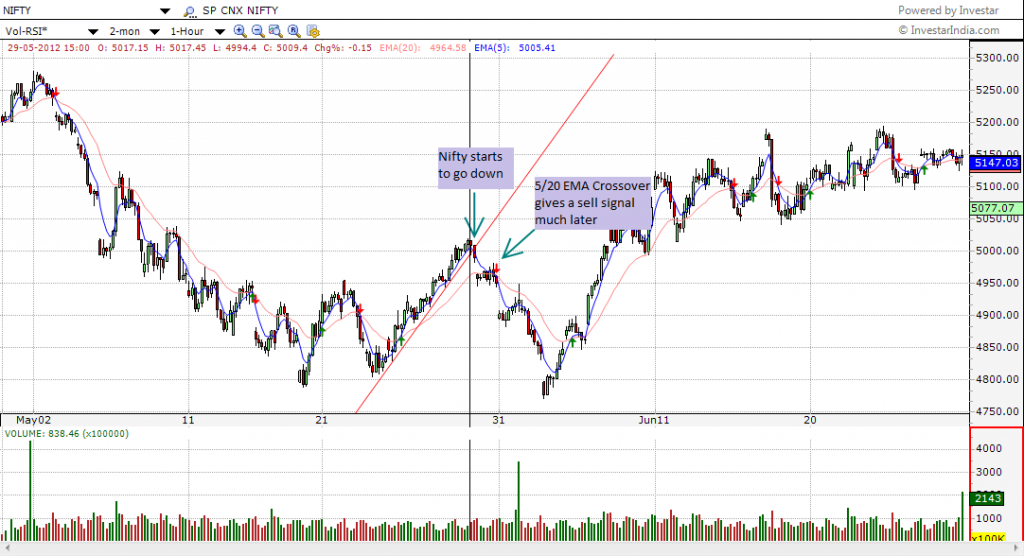
Trending indicators are typically drawn on price charts itself and usually fluctuate along with price movements (they can be used on another oscillator too but we’ll keep it simple here). Moving Averages are the best examples of trending indicators (e.g. an Exponential Moving Average or EMA for short). A moving average, as the name suggests, takes a moving average of closing prices and plots it on the price chart. e.g. an EMA(5) on an hourly chart will take the moving average of the last 5 hour bars and plot it on an hourly chart. Trending indicators like EMA are called lagging indicators because the Buy/Sell signals they generate generally lag the price action, meaning that a change in trend in price shows up in the indicator a little later. As you can see in the chart below, when Nifty changed to a downward direction, it was captured by the 5-20 EMA Crossover a little later (as indicated by the sell signal), hence it is called lagging.
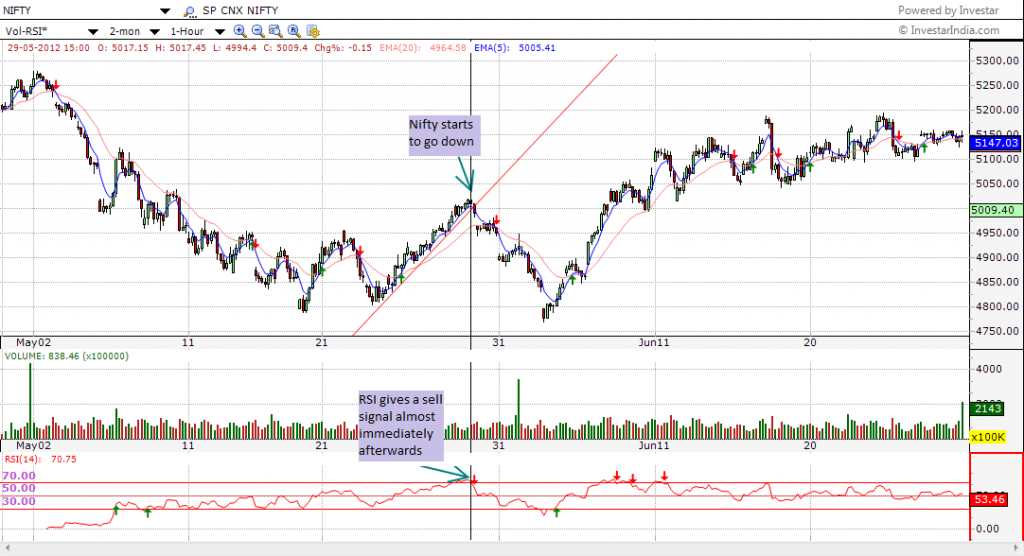
On the other hand, oscillating indicators or oscillators as they are called are plotted in a different area than the price chart and their values usually fluctuate above and below a center line or between an upper and lower level. Oscillators are also called leading indicators because the signals they generate are ‘leading’ and serve as an advance warning of a trend change or something similar that is about to happen. Examples of oscillators are Relative Strength Index (RSI), Stochastics, MACD, ADX etc. In the Chart below, you can see that the RSI fluctuates between 0 and 100 and Investar shows a sell signal when RSI goes below 70 and a buy signal when it crosses above 30. Another important point to note is that the the sell signal generated by RSI is almost at the same time that the Nifty started to go down and this is what is meant by the ‘leading’ behavior of RSI.
Like all techniques in Technical Analysis, indicators do generate false signals and knowing when they generate false signals depends on two things: 1) making sure you know the type of indicator and 2) identifying the current trend as this article suggests. As an example, knowing that EMA is a trending indicator and the fact that trending indicators generate lot of false signals in sideways trends leads us to a conclusion that 5/20 EMA Crossover buy/sell signals generate a lot of false signals in sideways trend and hence we need to cautious about 5/20 EMA crossovers in sideways trends.
So which the question is which one is better – an oscillator or a trending indicator? Or a combination of both? We’ll talk about this in a later post and see if using a combination of both helps us in making better Buy/Sell decisions.


In fact, the usage of indicators and oscillators is very clearly explained and the difference between lagging & leading indicators is very well elaborated. All the factors were given in simple language which is very easier to understand. Hope to have your valuable service in future too.
Thank you 😀
The discussion above was quiet good & true but the main point is how to avoid false signals, so just let me know in your later post where you decide how to use a combination of both to make better Buy / Sell decisions
The indicators are so well explained that I had not come across with such good & approiate explanation .Thanks & may your tribe increase.
very simple language…even a novice like me understood…..warning about false signals….difference between leggind and leading signals…..
i only wish if the lines drawn could be little more darker to enhance visibility
one more master stroke. your every post is opening a new thing in front of me.
There is no any autotrendline tab in option tools
Please make sure you are looking in “Investar Beta”: https://www.investarindia.com/Investar/DownloadsBeta.aspx. Auto-Trendline is only available to Auto-Support/Resitance Addon users.