Ichimoku Kinko Hyo called Ichimoku is a technical analysis method that builds on candlestick charting to improve the accuracy of forecast price moves. The indicator was developed by Goichi Hosoda, a Japanese journalist. He spent 30 years perfecting the technique before releasing his findings to the general public in the late 1960s.
Ichimoku Kinko Hyo, meaning “equilibrium at a glance chart“, allows a trader to rapidly and effortlessly evaluate the trend, momentum, and support and resistance levels in one chart.
The key elements
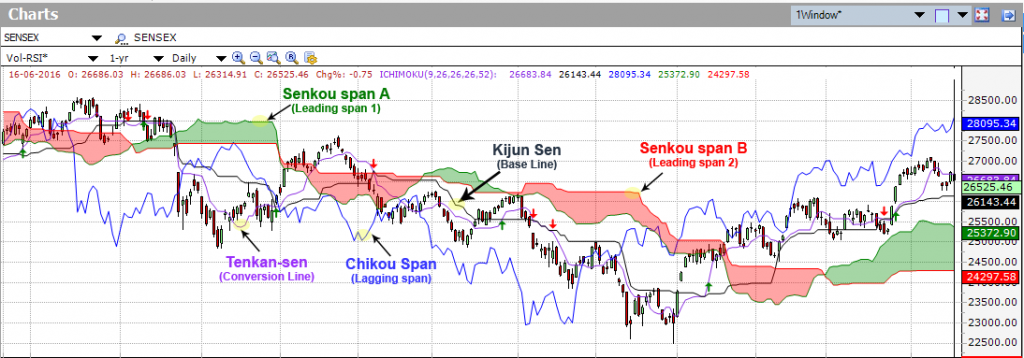
The Ichimoku chart consists of 5 parameters (9, 26, 26, 26, 52):
Tenkan-sen
It is primarily used as a signal line and a minor support/resistance line, often known as the Conversion Line. It is a moving average of the highest high and the lowest low over the last 9 trading days.
Kijun-Sen
This is a confirmation line, a support/resistance line, and can be used as a trailing stop line. It is a moving average of the highest high and the lowest low over the last 26 trading days.
Chikou Span
Also called the lagging span it is used as a support/resistance aid. It is today’s closing price plotted 26 days behind.
Senkou span A
Also called leading span 1, this line forms one edge of the kumo, or cloud. The average of the Tenkan Sen and Kijun-Sen, plotted 26 days ahead.
Senkou span B
Also called leading span 2, this line forms the other edge of the kumo. The average of the highest high and the lowest low over the last 52 days, plotted 26 days ahead.
Note: Things are to be emphasized that no chart element can be utilized in isolation; the chart needs to be considered as a complete keeping all elements.
Ichimoku Cloud Signals
Ichimoku Kinko Hyo is a technical trend trading charting system. Kumo (cloud) is the space between Senkou span A and B. The cloud edges identify current and potential future support and resistance points.
The Ichimoku Cloud helps traders to characterize support and resistance, price momentum, determine trading signals etc… , all in one.
There are five kinds of signals. Most can be classified as strong, or weak by their association to the Kumo (cloud ). Although it might appear to be at first complex to use an Ichimoku Cloud indicator, with a little practice it can probably turn out to be one of the most efficient and genuine methods to figure out buy and sell signals.
Tenkan Sen / Kijun Sen Cross
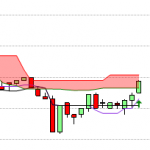
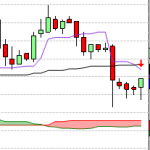
Ichimoku indicator supports crossover-based signals. When Tenkan (Conversion) crosses above Kijun (Base), it will generate a Buy Signal and when Tenkan (Conversion) crosses below Kijun (Base), it will generate a Sell Signal.
 |
 |
| A weak bullish signal occurs when the cross is below the Kumo (cloud). | A strong bullish signal occurs when the cross is above the Kumo (cloud). |
 |
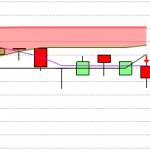 |
| A weak bearish signal occurs when the cross is above the Kumo (cloud). | A strong bearish signal occurs when the cross is below the Kumo (cloud). |
Kijun Sen Cross (Base Line Cross)
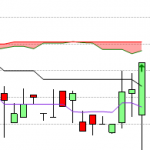
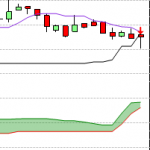
When price moves above the Kijun (Base) Line, it will generate a Buy Signal and when Price moves below Kijun (Base) Line, it will generate a Sell Signal.
 |
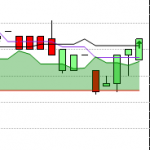 |
| A weak bullish signal occurs when the cross is below the Kumo (cloud). | A strong bullish signal occurs when the cross is above the Kumo (cloud). |
 |
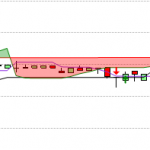 |
| A weak bearish signal occurs when the cross is above the Kumo (cloud). | A strong bearish signal occurs when the cross is below the Kumo (cloud). |
Kumo Breakout
When price goes upwards through the top of the Kumo (cloud), it will generate Buy Signal and when price goes downward through the bottom of Kumo (cloud), it will generate Sell signal.
 |
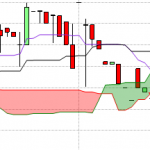 |
| A bullish signal occurs when the price goes upwards through the top of the Kumo (cloud). | A bearish signal occurs when the price goes downwards through the bottom of the Kumo (cloud). |
Senkou Span Cross
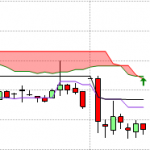
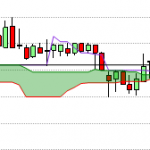
When Cloud (Kumo ) turns from red to green, it will generate a Buy Signal and when Cloud (Kumo ) turns from green to red, it will generate a Sell Signal.
 |
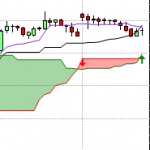 |
| A weak bullish signal occurs if the current price is below the Kumo (cloud). | A strong bullish signal occurs if the current price is above the Kumo (cloud). |
 |
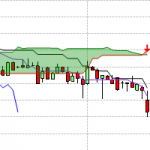 |
| A weak bearish signal occurs if the current price is above the Kumo (cloud). | A strong bearish signal occurs if the current price is below the Kumo (cloud). |
Chikou Span Cross (Lagging Span Cross)
When Price moves above Chikou Span (Lagging Span), it will generate a Buy Signal and when Price moves below Chikou span, it will generate Sell Signal.
Evaluating the Ichimoku Cloud
The Cloud (Kumo) is considered the most significant feature of the Ichimoku Cloud plots. The Leading Span 1 and Leading Span 2 form the Cloud. The cloud edges determine current and potential future support and resistance points. A price above the Kumo indicates a bullish trend and a price below indicates a bearish one, whereas price within the Kumo signifies a possibly trend-less scenario. Traders often look for Kumo Twists in future clouds, where Senkou Span A and B exchange positions, a signal of potential trend reversals. There is certainly one very unique thing about cloud. It can be shifted forward, this part is called future Kumo.
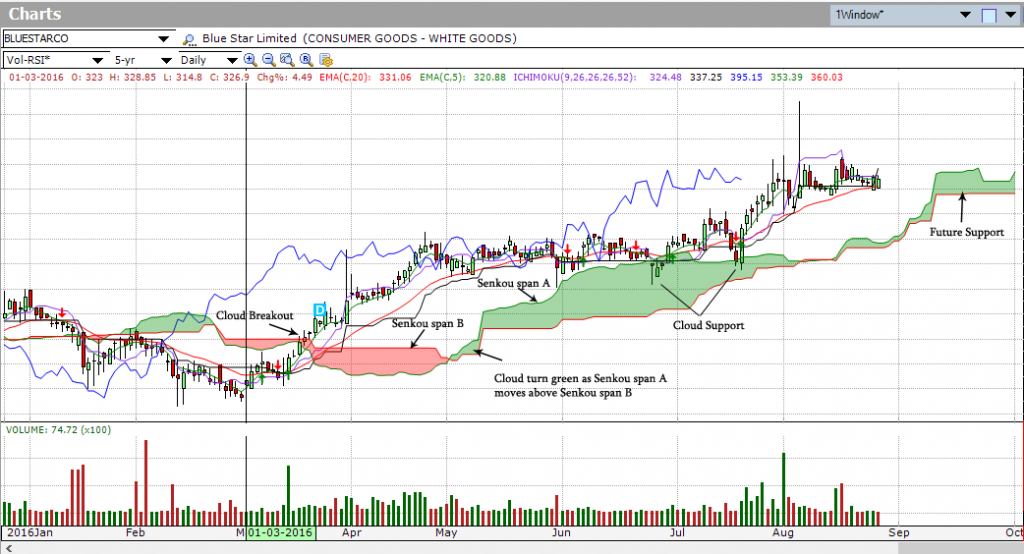
Below chart shows an example of Ichimoku applied on BLUESTARCO. First, notice that BLUESTARCO broke Cloud support in mid March. Second, notice how the Cloud changed from red to green when the Leading Span A (green) moved above the Leading Span B (red) in May. The cloud break represented the first trend change signal, while the colour change represented the second trend change signal. Third, notice how the Cloud act as a support in June, July, Aug. Fourth, notice how the Cloud provides a glimpse of future support. The entire Cloud is shifted forward 26 days. This means it is plotted 26 days ahead of the last price point to indicate future support or resistance.
you have said the below. this is wrong. kindly correct it please.
Chikou Span Cross (Lagging Span Cross)
When Price moves above Chikou Span (Lagging Span), it will generate a Buy Signal and when Price moves below Chikou span, it will generate Sell Signal
Sir, I think you have misunderstood the statement.