Best Technical Analysis Software for Indian Stock Market
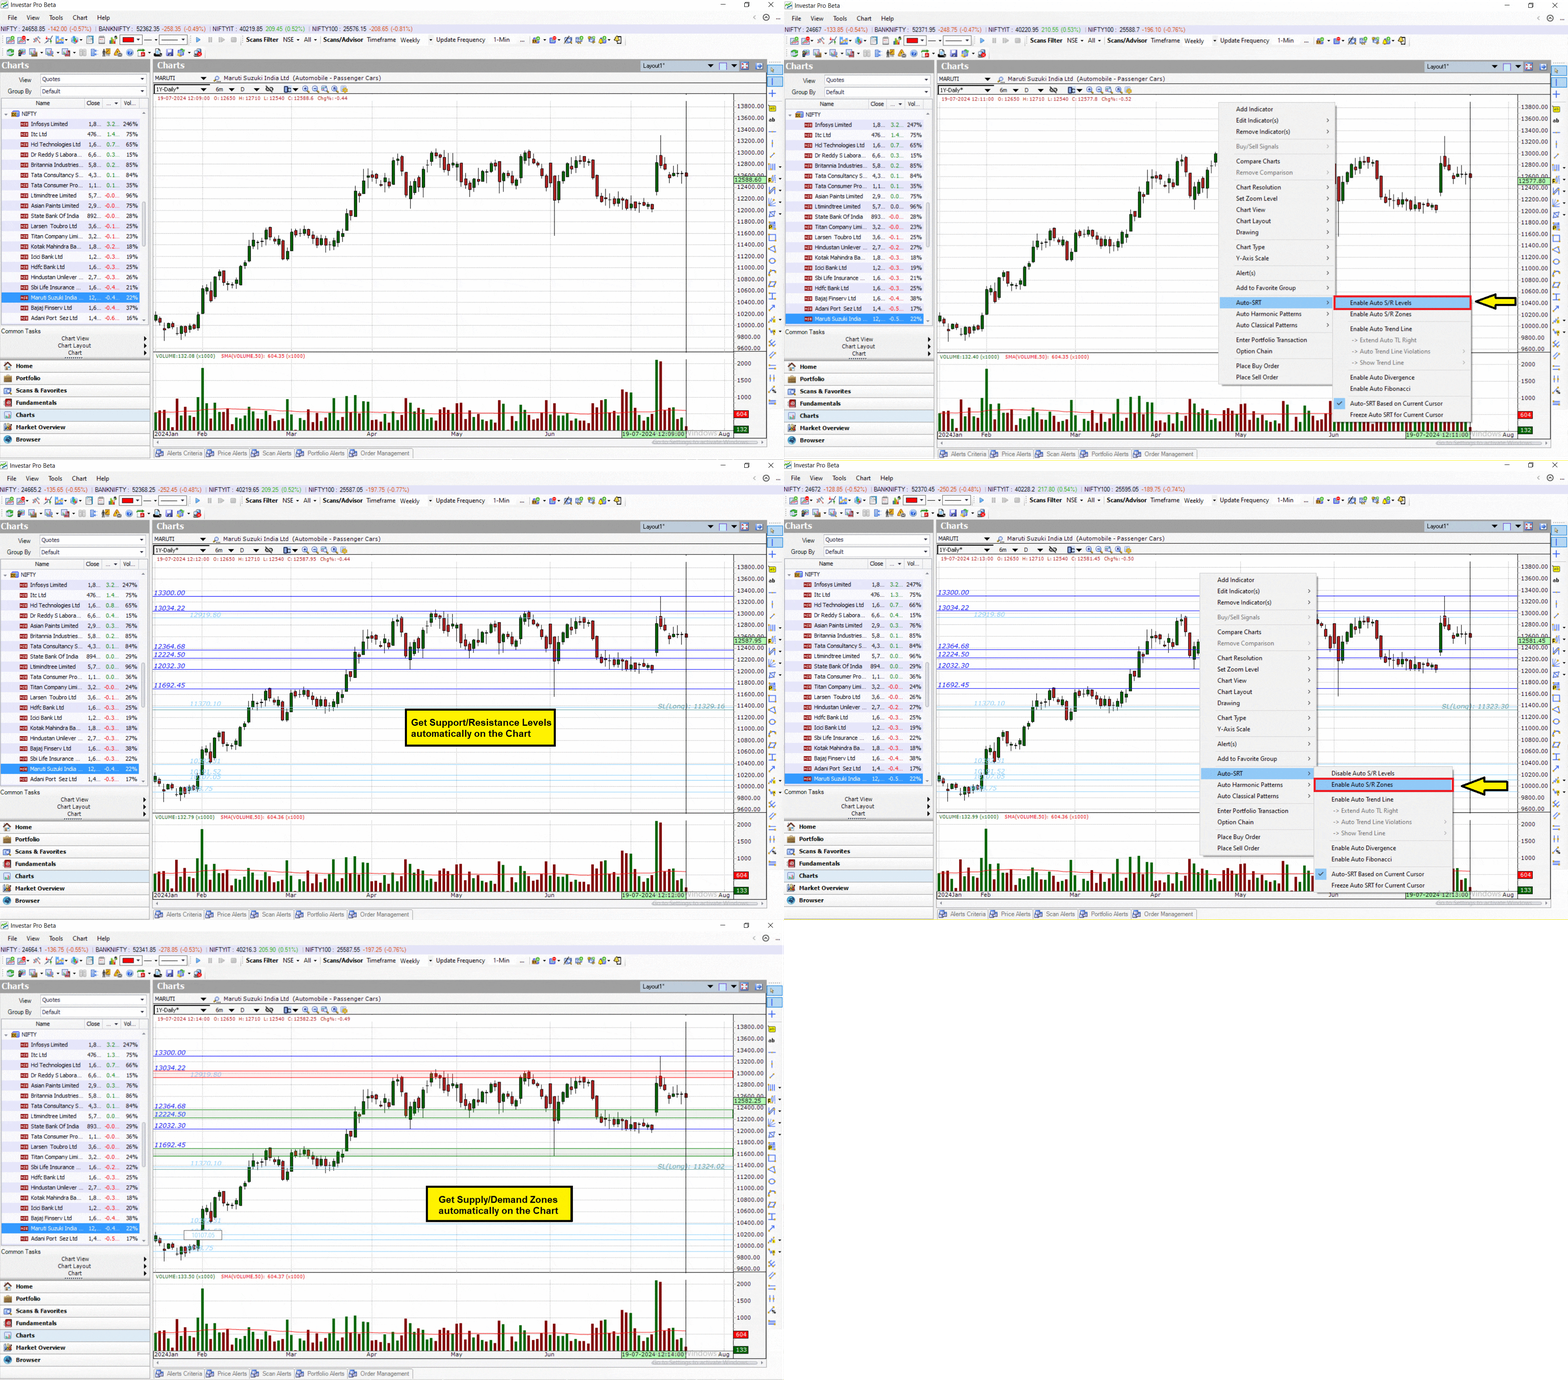
Investar Technical Analysis Software offers exclusive features not found elsewhere, including our proprietary Auto-Support/Resistance and Auto-Supply/Demand Zones feature (powered by AI). Unlike other software, where manual plotting is required, Investar automatically generates these critical levels when you visit a chart. This makes it accessible even for those not adept at technical analysis. Investar also scans for stocks breaking out of resistance, helping you identify volume breakouts effortlessly. Additionally, it provides accurate targets & stop-losses, and high Reward-to-Risk ratio trades, ensuring long-term trading profitability. The example below shows how Investar plots Auto-Support/Resistance and Auto-Supply/Demand Zones on the chart with ease.

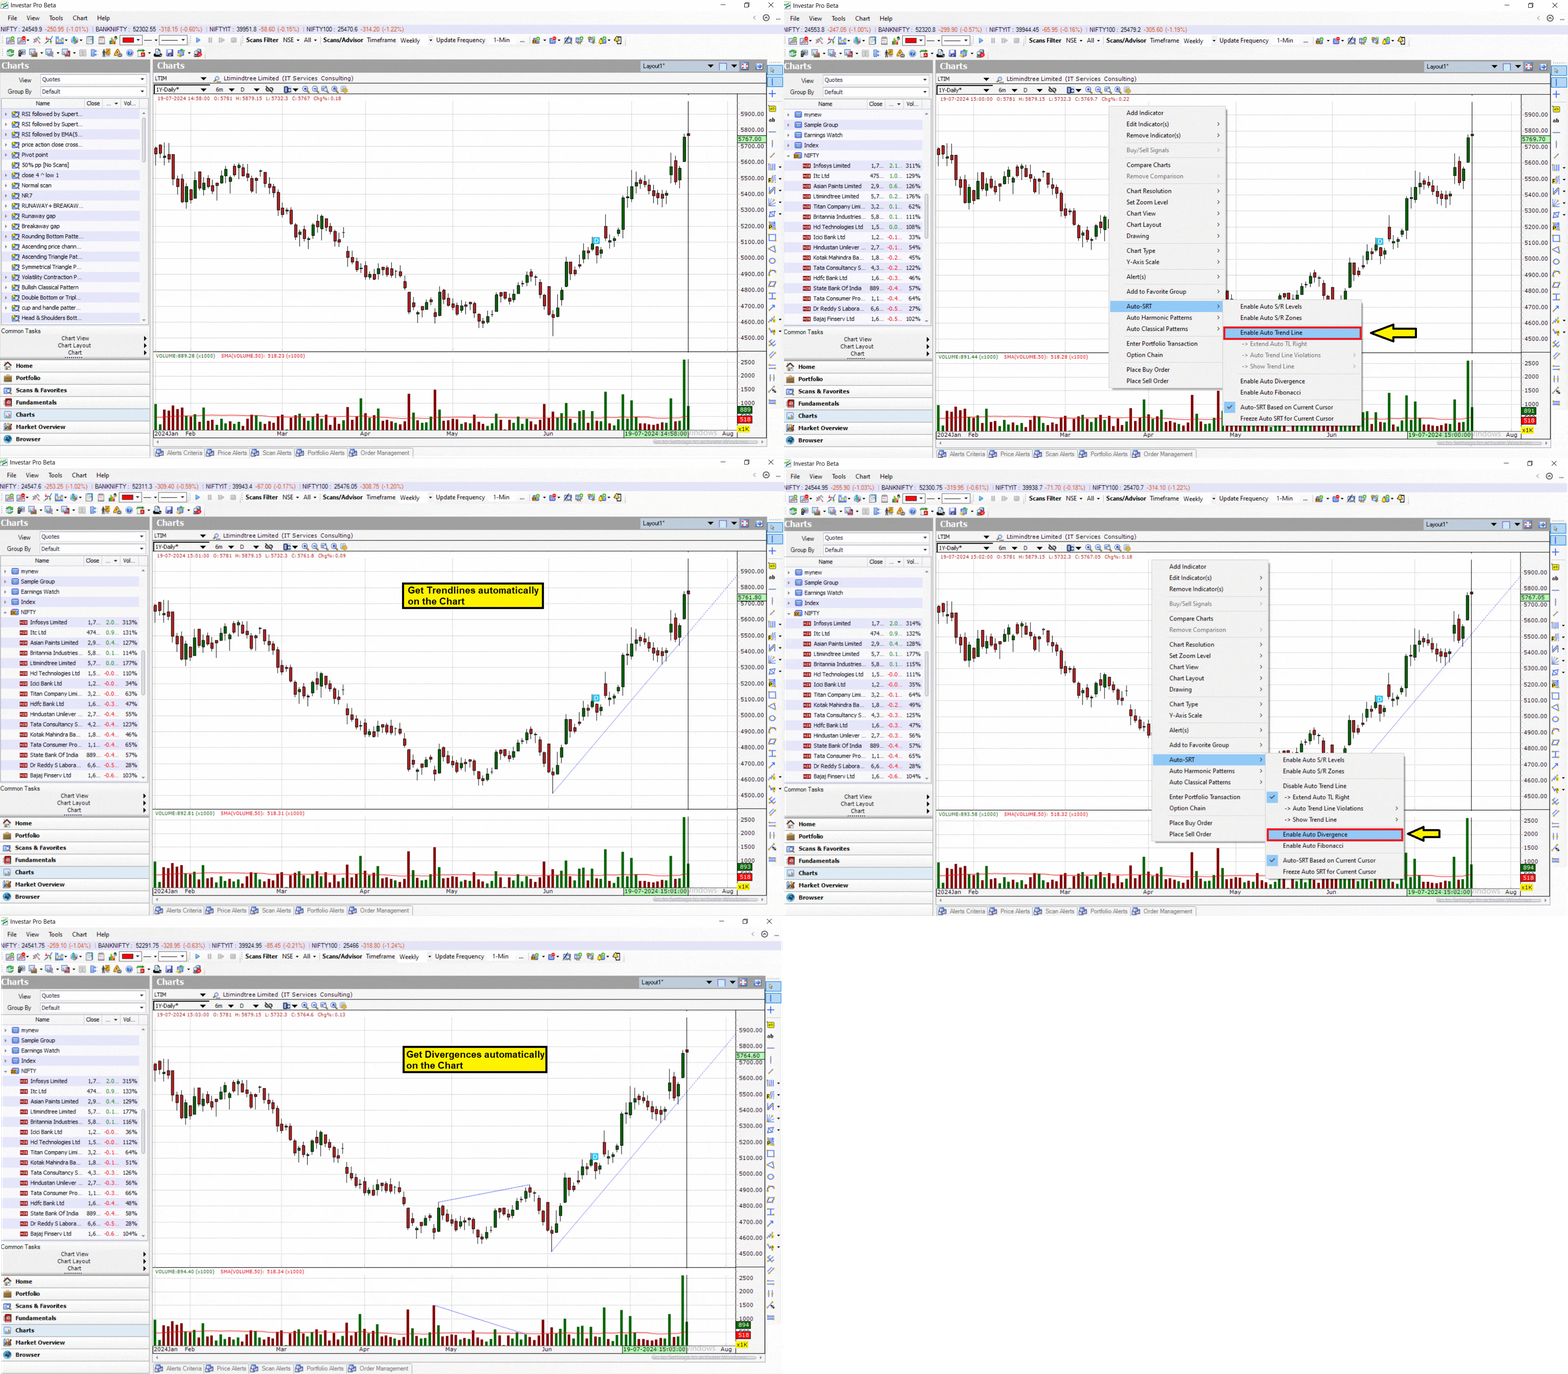
Trend identification is usually done by drawing Trendlines manually in most Technical Analysis Software, but in addition to that, Investar has an Auto-Trendline feature that will automatically draw trendlines on visiting a chart on whichever timeframe you have chosen. Our Auto-Divergence feature also helps find out divergences in price and oscillators like RSI, MACD, Stochastics etc. See the example below to witness how Investar software effortlessly plots Auto-Trendlines and Auto-Divergence on the chart.

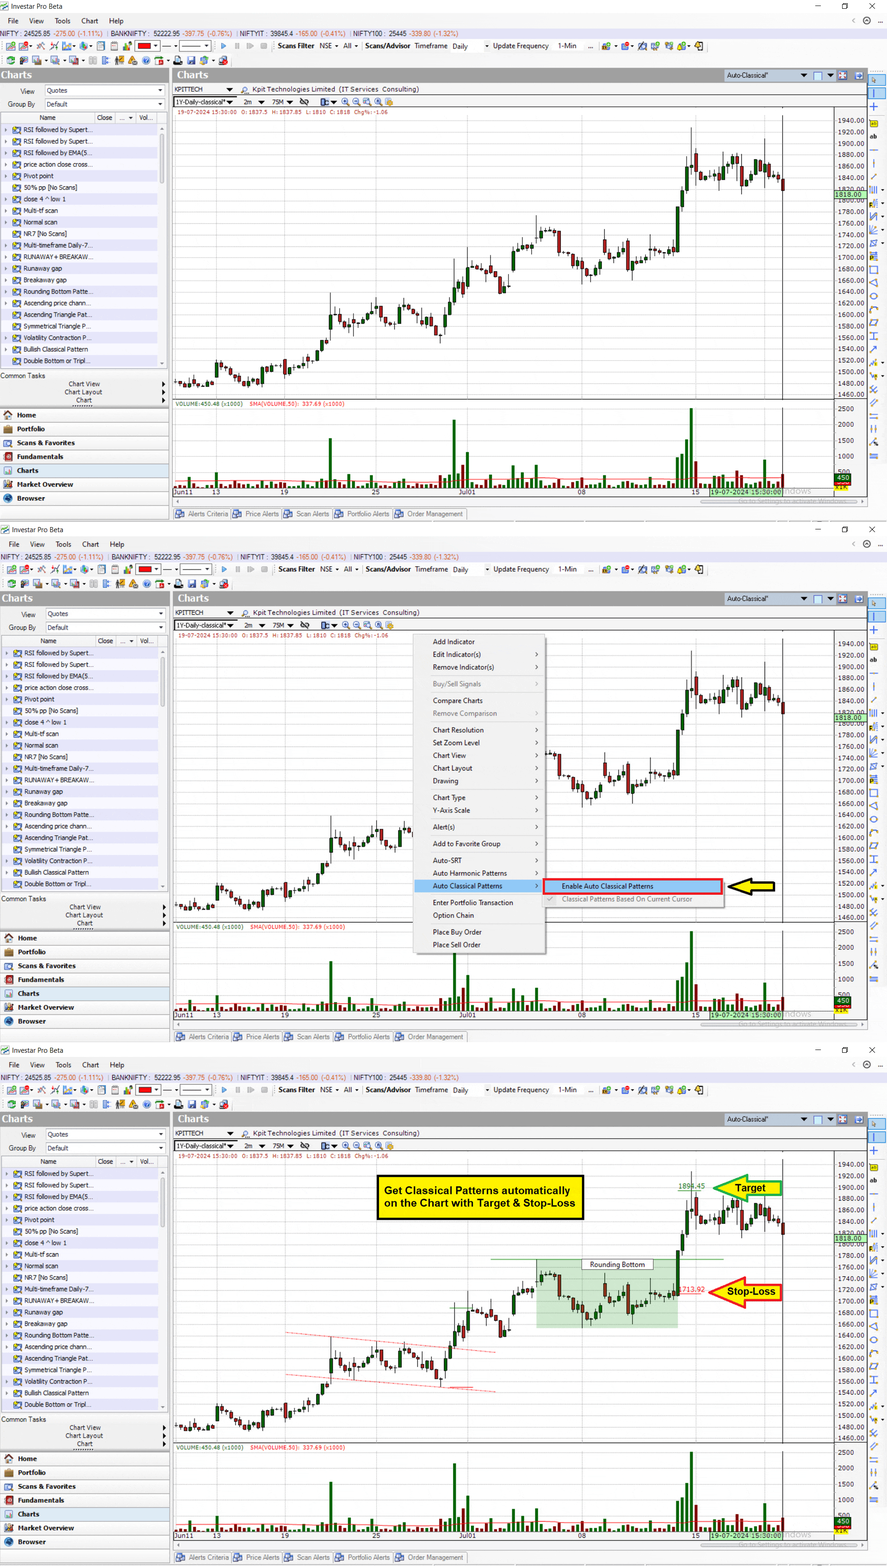
If you use Classical Patterns in your Technical Analysis, then Investar comes with the Auto-Classical Pattern feature which automatically identifies most Classical Patterns like Head and Shoulders, Double Top/Bottom, Cup-with-Handle and many others on simply visiting a chart. What’s more, it also scans for stocks and futures that are forming these patterns. Take a look at the example below to see how Investar software automatically plots Auto-Classical Patterns along with Target & Stop-Loss on the chart.

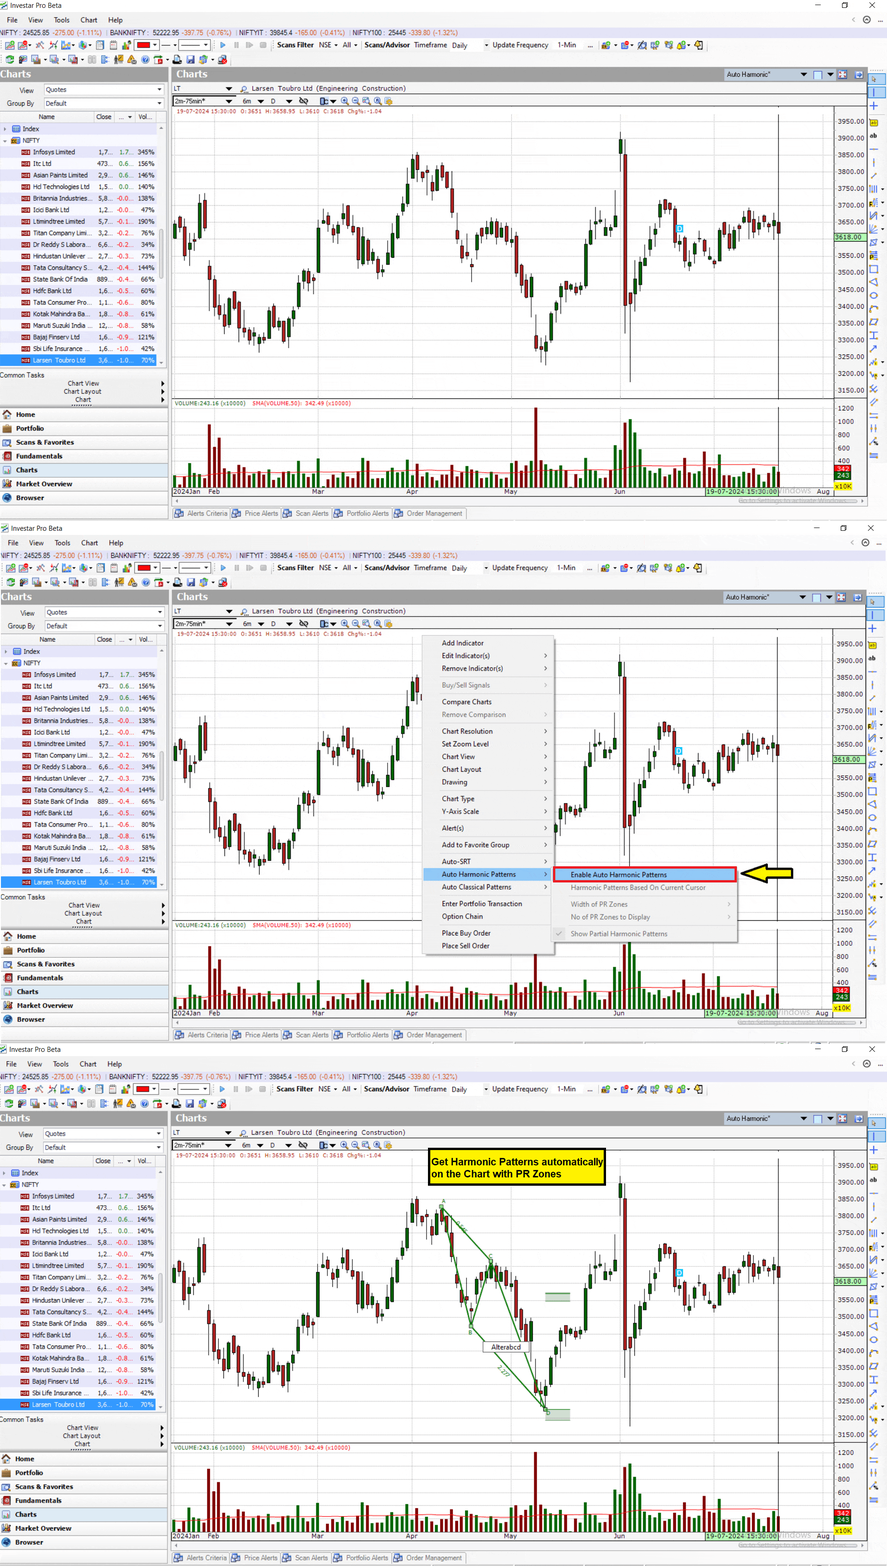
If you use Harmonic Patterns in your Technical Analysis, then Investar comes with the Auto-Harmonic Pattern feature which not only automatically identifies most Harmonic Patterns on simply visiting the chart but also scans for them. Here's an example highlighting how Investar software automatically displays Auto Harmonic Patterns Potential Reversal Zones to set the Targets and Stop-loss values in the chart.

To top it all, Investar Annual Subscription (Standard Edition and above) also come with Free Technical Analysis Training to ensure you learn to perform Trend Analysis and Support/Resistance Analysis to perfect your Buy and Sell timing to get an upto 83% success rate.
- Get Swing-Trading ideas with powerful Screener.
- Automatic Buy/Sell Signals in Charts.
- Bullish/Bearish Pop-up Alerts on Favorite Scrips.
- Get daily trading ideas with 190+ Technical & Fundamental Scans.
- Integrated Technicals & Fundamentals with Expert Advisor.
- 65+ Popular Technical Indicators with 35+ Drawings.
- Powerful Portfolio Manager with user-friendly import.
- Short Term/Long Term/F&O Capital Gains.
Still not convinced that Investar is the Best Technical Analysis Software?
Click on any menu on the left for more details or see all the Technical Analysis Software Features available in all editions.