We are pleased to announce a new release of Investar Beta with enhanced Harmonic Pattern features like:
- Potential Reversal Zones ( or PR Zones – To make it easy to find targets and stop-losses)
- Partial Harmonic Patterns (where D Point is near but not on the current candle )
- Many New Harmonic Patterns
-
- Alter Shark
- Max Bat
- Max Butterfly
- Max Gartley
- White Swan
- Black Swan
- Sea Pony
What are PR Zones?
PR Zones or Potential Reversal Zones as they are called, are areas created due to confluence of Fibonacci retracement levels of a Harmonic Pattern’s legs (e.g. XA, BC, AB=CD), where the chances of reversals are high. Hence, they can be used as a target or stop-loss.
PR Zones in Investar can be:
- At the D Point (which is specified in terms of % value of D price) or
- A confluence of Fibonacci retracements which indicate targets.
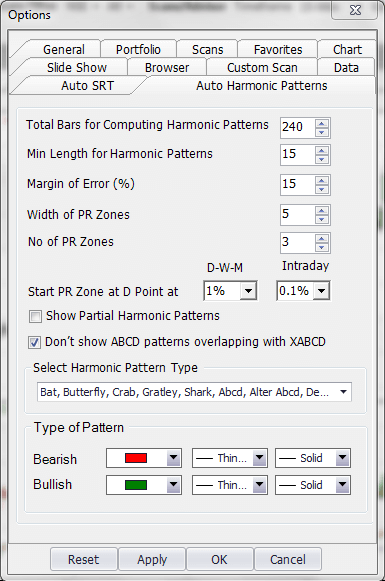
To specify the above, go to Tools-Options-Auto-Harmonic Patterns tab, and the following options can be set:
- Width of PR Zones – this specifies the width of PR Zones in increments of 5.
- No of PR Zones – Total no of PR Zones including the one at D
- Show PR Zone at D Point at – This value indicates the % tolerance around the D point at which a PR Zone is drawn.

How to use PR Zones in your trading?
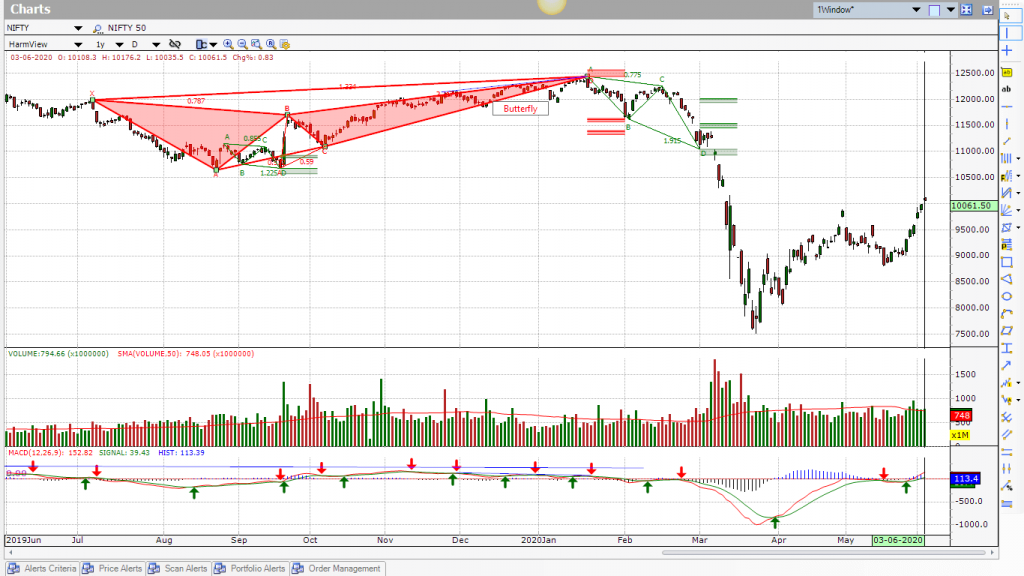
To understand how to use PR Zones, let’s look at an example chart of NIFTY as below. Here we can see that a bearish Butterfly Harmonic Pattern was formed on 20th Jan, 2020. The 3 red zones indicate the PR Zones where the potential reversal can happen and hence they can be used as a target.
When a bearish Harmonic Pattern is formed, the price will tend to reverse from the D point (If it goes above the D point PR Zone, it would invalidate the pattern, hence the stop loss would be at the top of the high of the D point PR Zone). Once the price reversed at the D point PR zone, the target was correctly given by the next red PR Zone as shown in the chart.
The green pattern that happened later on is an example where the D point reversal did not take place and our stop loss got hit.
Hence PR zones are a very useful tool for a Harmonic trader to decide what target and stop-loss to set.
Partial (or Incomplete) Harmonic Patterns
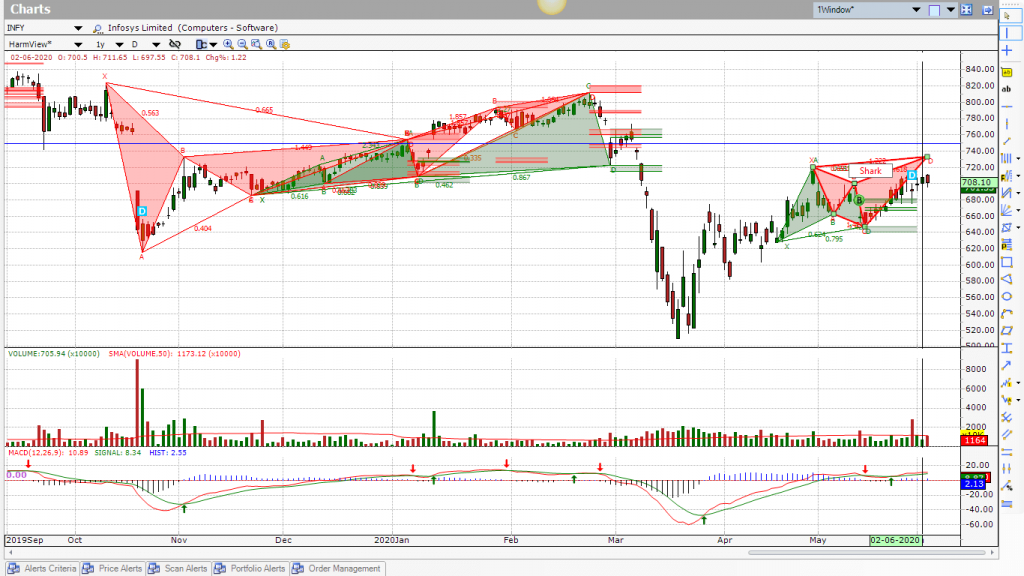
At times you want to be ready to take a Harmonic trade as soon as the D Point is complete. This new feature enables you to see at what point in the future the D Point is going to complete so that you can be prepared to take the trade accordingly. In the following INFY chart, you can see the D point on the Shark pattern near the current candle but not on it. This is indicating the potential value of the D point at which it will complete, in case a trader wants to be ready to take the trade as soon as it completes (i.e. you go short when the current price reaches the value indicated by the D point of the incomplete Harmonic Pattern).
New Harmonic Patterns
We have also added a few new Harmonic Patterns like:
- Alter Shark
- Max Bat
- Max Butterfly
- Max Gartley
- White Swan
- Black Swan
- Sea Pony
New Harmonic Scans
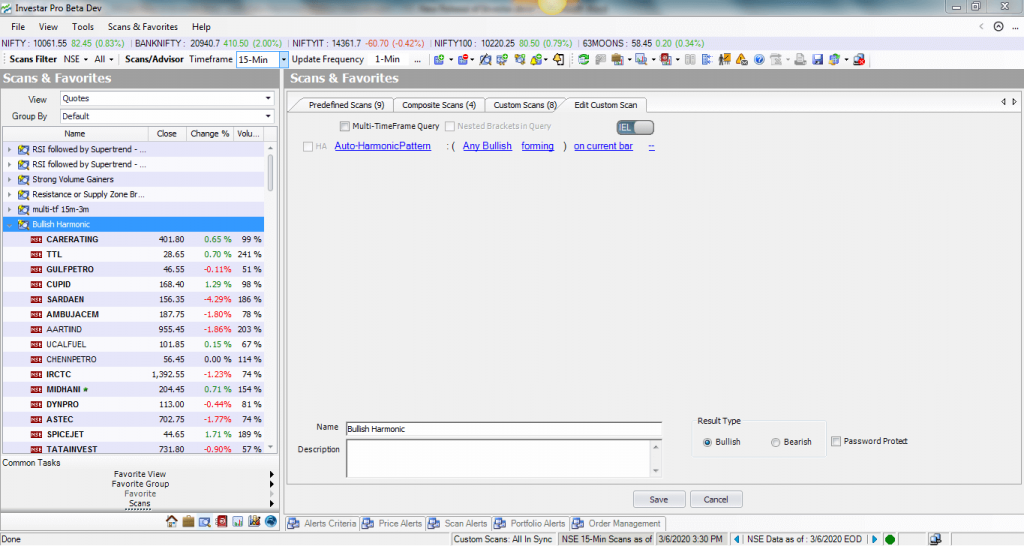
Apart from the new pattern scans, now you can create a scan for any Bullish (or Bearish) Harmonic Pattern as shown in the screenshot below:
We hope you can enjoy the new Harmonic Pattern features as much as we enjoyed developing them.
If you’d like to see the above features in action, you can see the “Enhanced Harmonic Patterns” video.


I want see the Demo of your software please give trial
You can download & get free trail of our software. https://investarindia.com/user/sign-up