In this post, we will be discussing the NR7 Trading Strategy which is basically a Price Action based trading strategy. Price Action Trading does not involve any indicators, it is totally based on the price action of a particular stock or index.
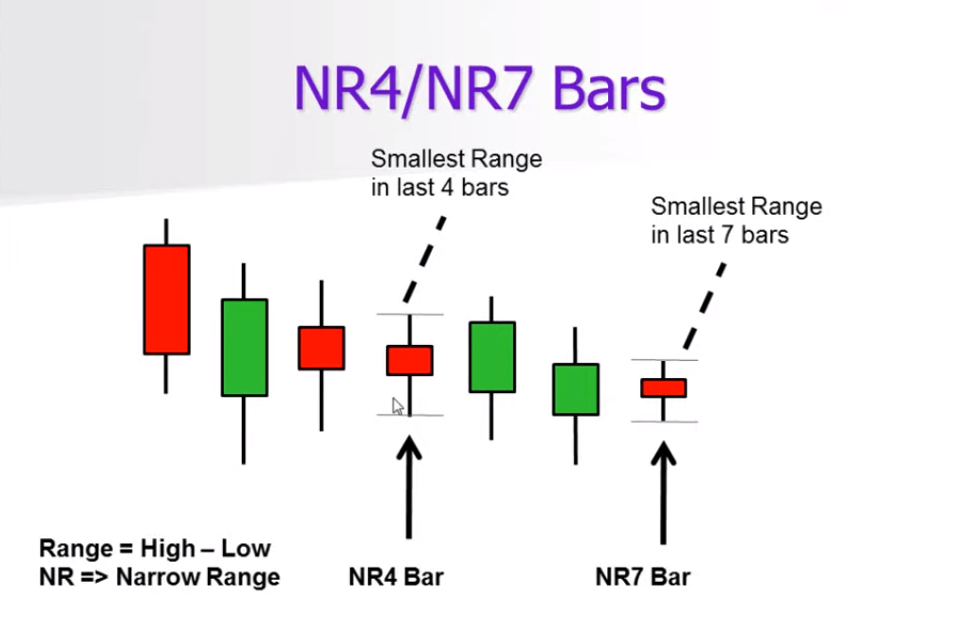
But first, let’s understand what is NR7. NR in NR7 stands for “Narrow Range”, where Range = High – Low. As the name indicates, this strategy tries to identify stocks where the range is narrowing and the current bar’s range is the lowest amongst 7 bars ( i.e. 6 bars excluding the current bar). Another related strategy is the NR4 which tries to identify stocks where the range is narrowing and the current bar’s range is the lowest amongst 4 bars ( i.e. 3 bars excluding the current bar). Here is a figure showing both the strategies.
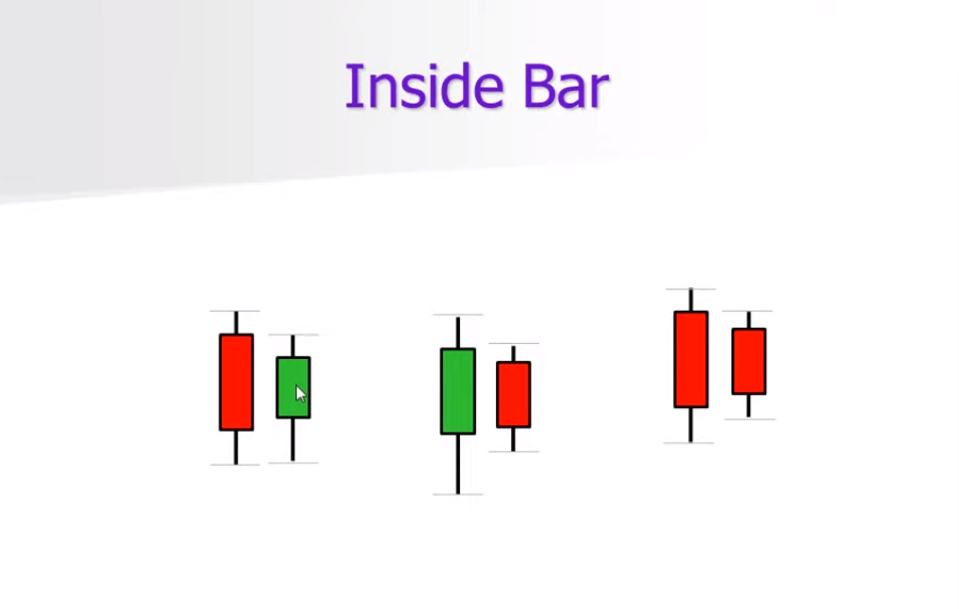
But to understand this NR7 Trading Strategy we will also need to understand what is the Inside Bar. As shown in figure below, Inside Bar is a bar (or candlestick which is totally contained within the previous bar (i.e. the High is lower than the previous High and Low is higher than the previous Low).
Trade Profitably based on NR7 Breakout Trading Strategy
Now, in the most popular version of the NR7 Trading Strategy (see figure below), when an NR7 candle is formed which is also an Inside Bar, a bullish breakout happens when on the next candle the stock closes above the high of the NR7 candle. The buying price is then the close of this candle. The stop-loss is the low of the NR7 candle.
Similarly, as shown in the figure below, a bearish breakout happens when on the next candle the stock closes below the low of the NR7 candle. The selling/shorting price is then the close of this candle. The stop-loss is the high of the NR7 candle.
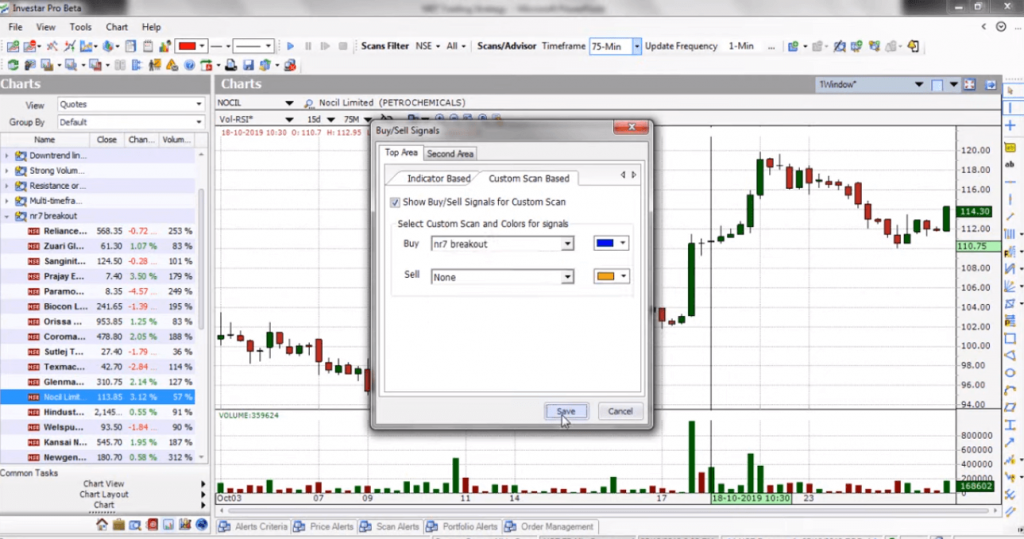
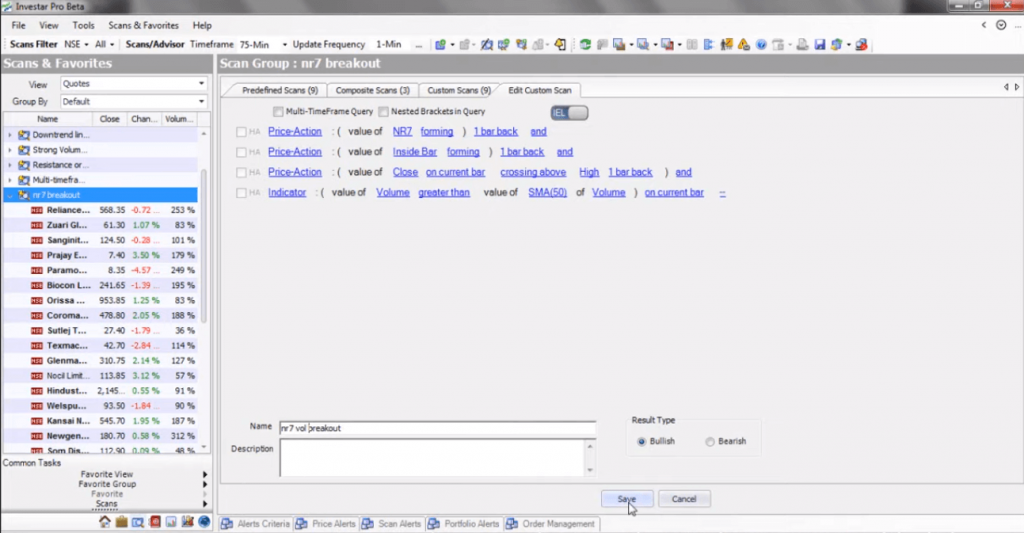
You can create a scan for this NR7 Trading Strategy in Investar as shown in the screenshot below.
We can also set the Buy/Sell signals based on this Custom Scan as shown below.
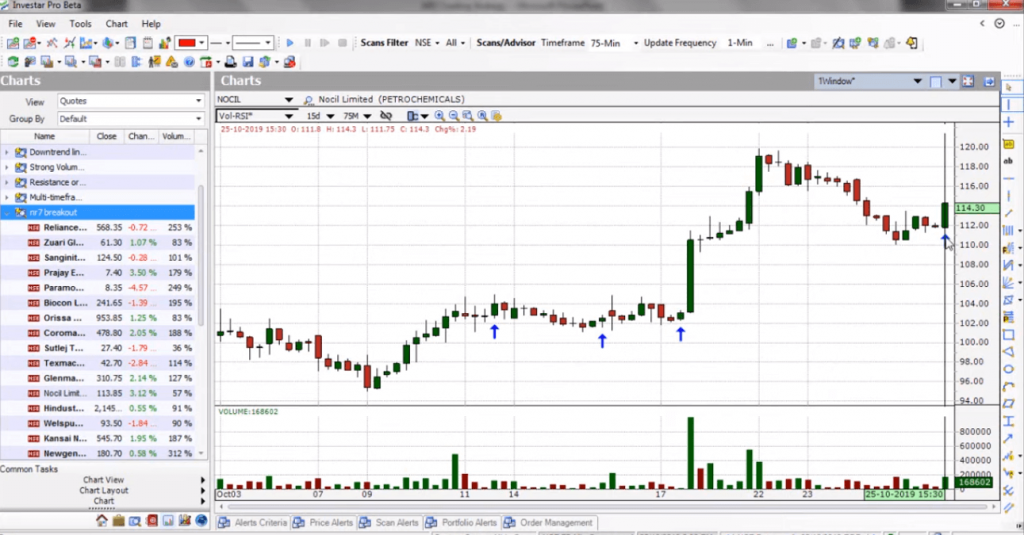
If we do that, then a blue arrow will be shown on any stock chart (e.g. NOCIL) appearing in the scan on the last candle, but we will also see blue arrows elsewhere in the chart which turn out to be false signals as shown in chart below:
In order to minimize the false signals, we can put an additional volume filter in our custom scan as shown below:
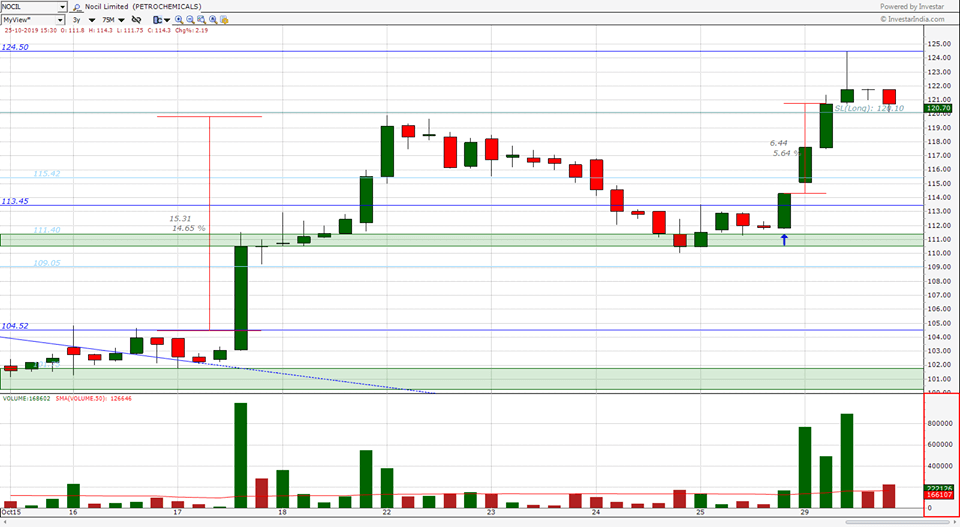
Once we apply this new updated scan, the Custom Scan results will be updated as per the new updated scan, and also a lot of the false signals will disappear as shown in the same NOCIL chart below.
As you can see, adding volume as an additional filter to the popular NR7 Trading Strategy has eliminated a lot of the false signals, and it so happened that this stock, after doing the NR7 breakout, went up by almost 5.6% in about 2 days after the signal shown in the chart above on Oct 25, 2019.
Another important point to note is that in case there is an Auto-SRT Resistance or Supply/Demand Zone very near the breakout of the NR7 candle, it is best to wait for that resistance also to be broken before entering the trade.
For more details, check out our video on “NR7 Trading Strategy – Trade Profitably based on NR7 Breakout Trading Strategy” for an in-depth look into this topic :
Want to try out this NR7 trading strategy?
Click on the button below to download a Free 7-day trial of Investar:



Thanks for sharing charts to explain NR7 Trading Strategy.
Glad you enjoyed it.
Excellent writing . it is actually useful for me. Keep writing and happy blogging.
Glad you enjoyed it.