Intraday trading is a fast-paced game. You need to buy and sell securities within a single day. Therefore, you have to make quick decisions. That is why it is very important to choose the best indicators for intraday trading to interpret market behavior and identify potential entry and exit points. In this blog, we are going to discuss the best indicators for day trading. We will explore their functionalities and how they can inform your trading decisions.
Understanding Technical Indicators for Intraday Trading
Technical indicators are mathematical calculations applied to historical price and volume data. They are used to gauge potential future price movements. They offer insights into market sentiment, momentum, and volatility. These vital aspects are used to judge the short-term currents. Also, if you master these indicators, you can go one step ahead in technical analysis.
Top 5 Intraday Trading Indicators
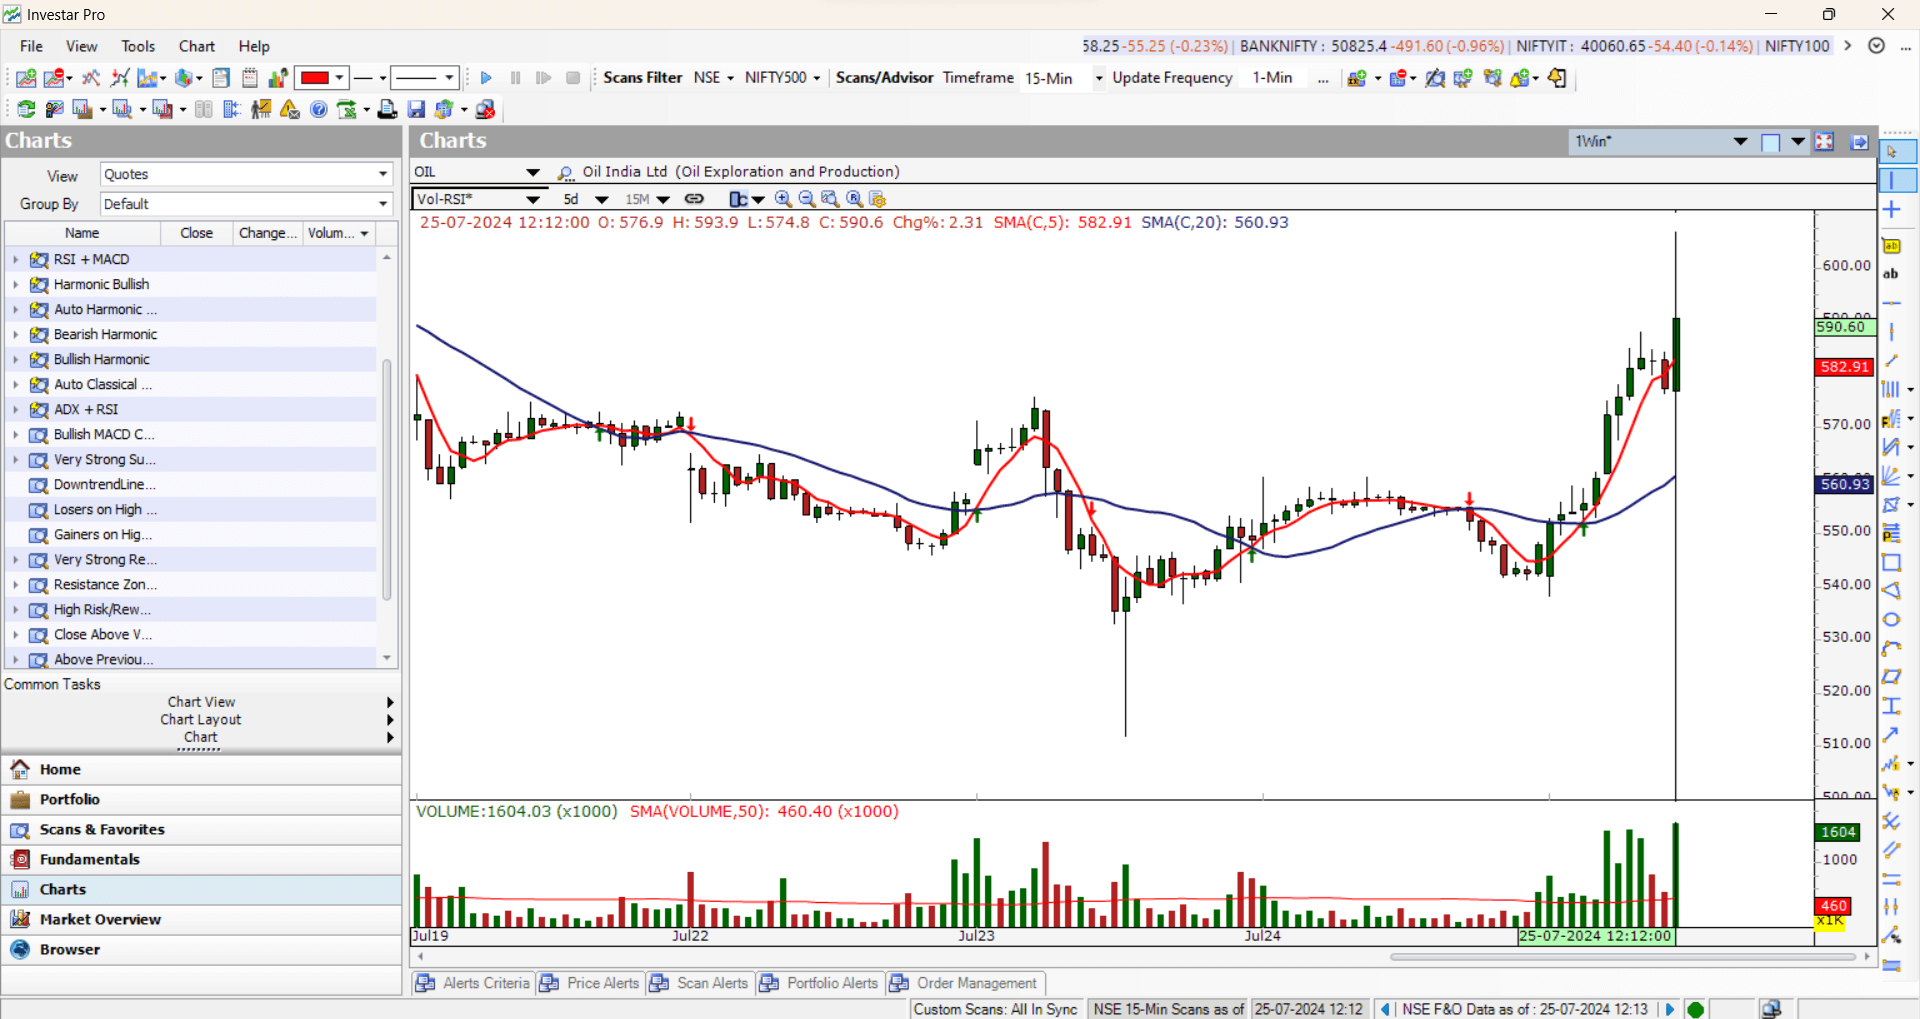
Moving Average (MA):
- We mostly use Simple Moving Average (SMA) or Exponential Moving Average (EMA) for intraday trading. Moving averages help traders to filter out the price noise.
- In day trading, short-term moving averages (e.g. 5, 20 periods) can act as support and resistance levels.
- Also, you can use them as crossovers. If a smaller MA (5-period) crosses above the longer MA (20-period), it will generate a buy signal.
- A divergence between price and MA can indicate potential trend reversals.
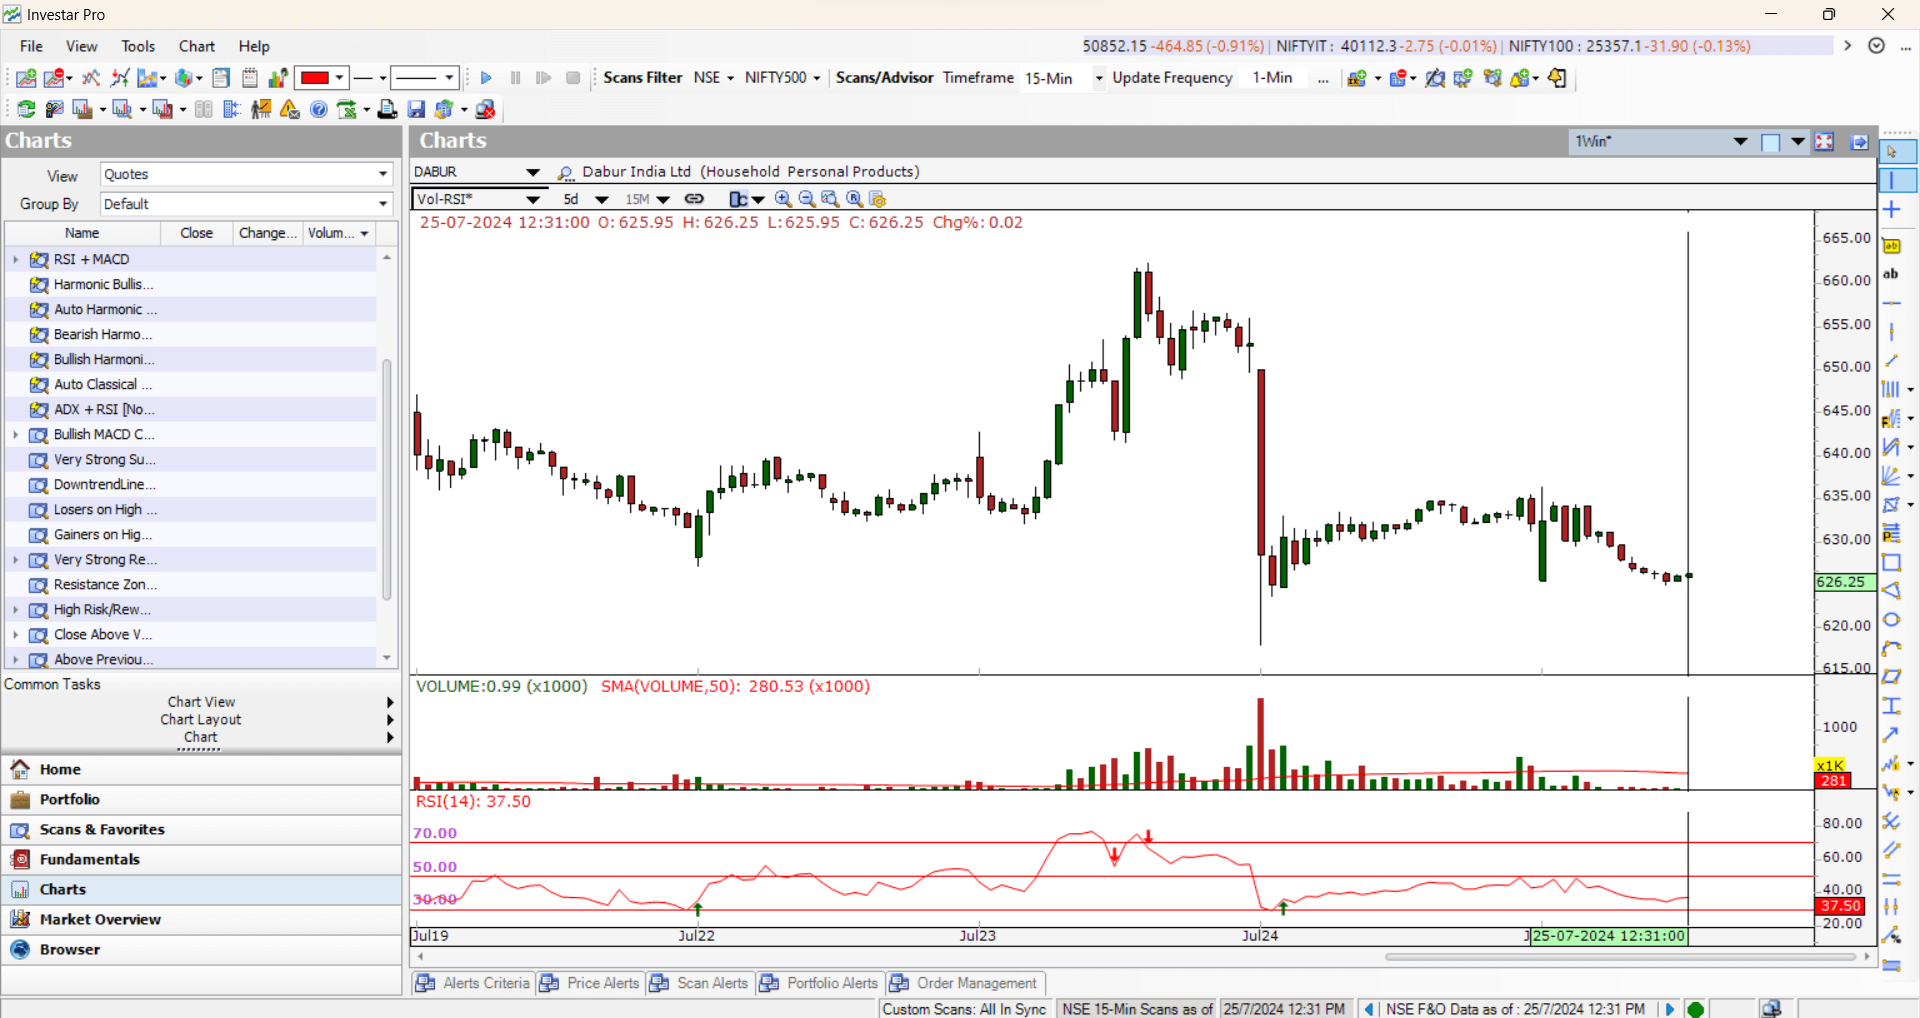
Relative Strength Index (RSI):
- RSI is a momentum oscillator. It can measure the speed and change of price movements.
- If it goes above 70, it indicates the overbought conditions. And below 30, it suggests oversold conditions.
- Also, you can use this indicator in divergence. It can signal potential trend reversals or trend continuations.
- RSI can be used to identify potential entry and exit points in intraday trading.
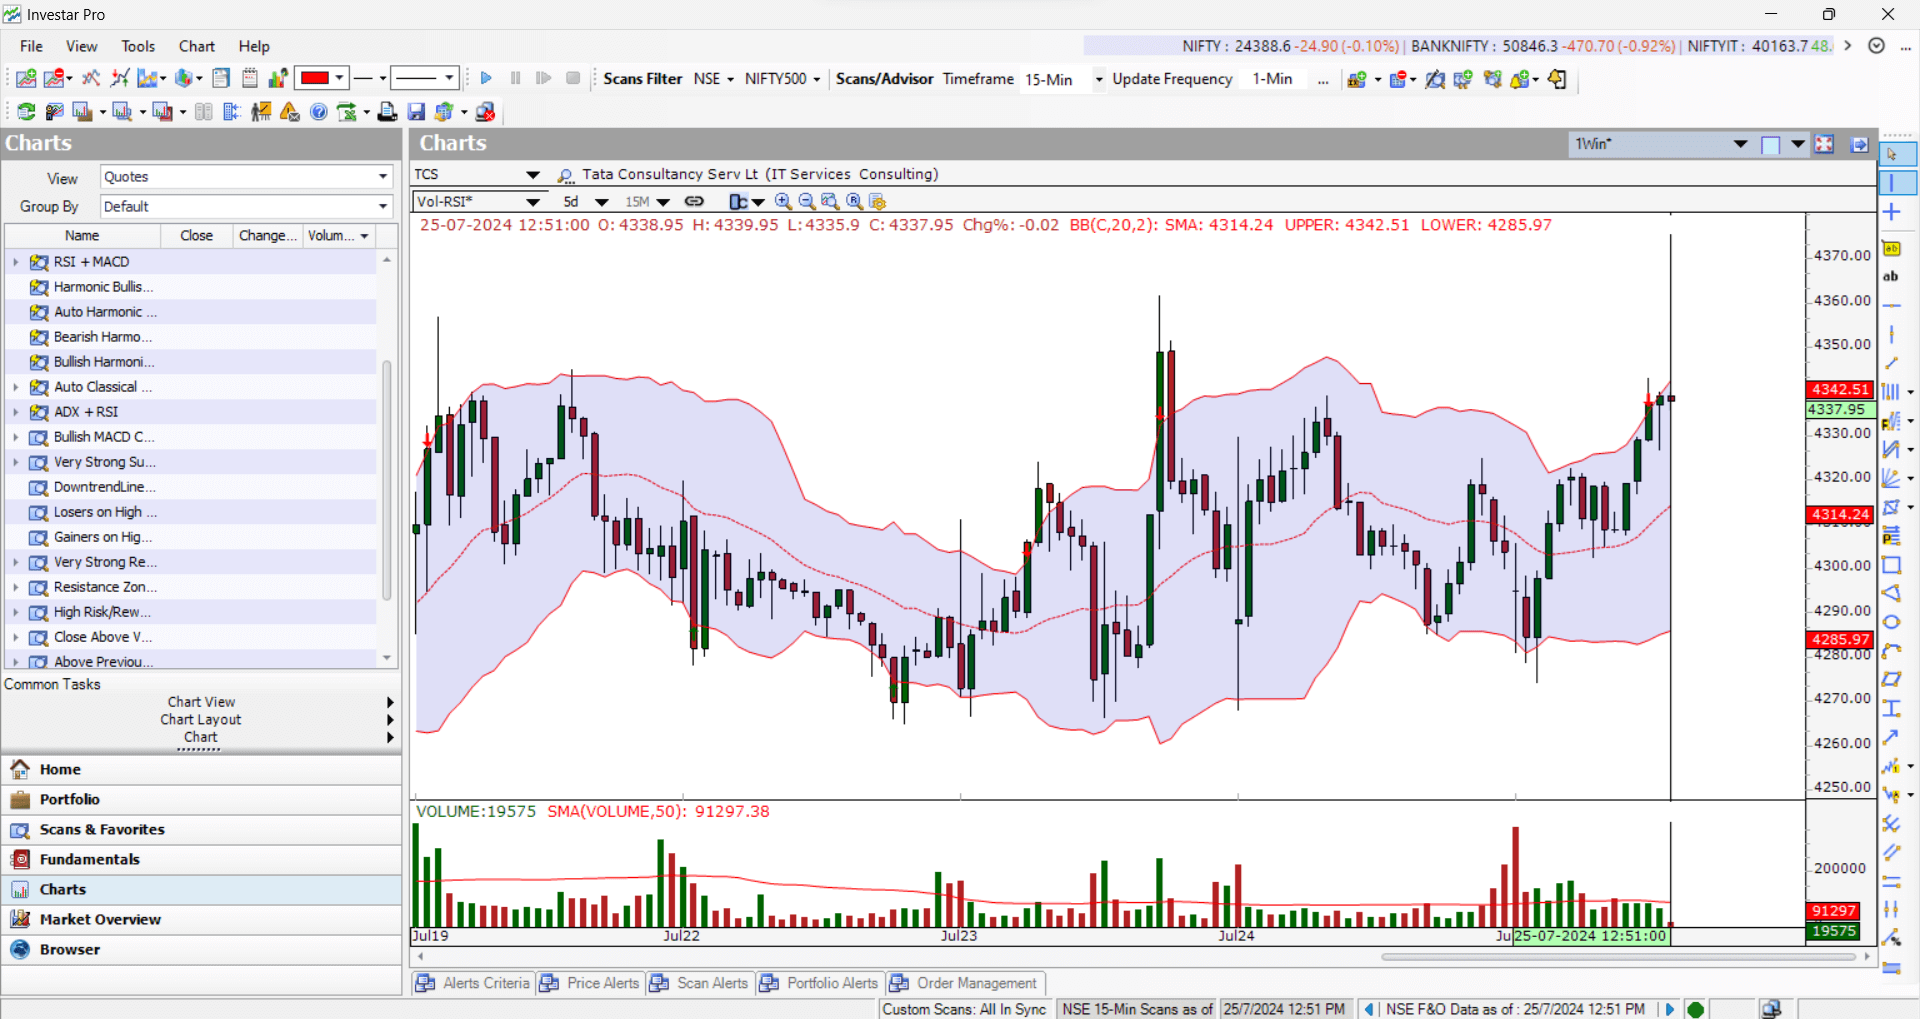
Bollinger Bands:
- Bollinger Bands is a volatility indicator. There is an upper band and a lower band around a moving average. The moving average is generally a 20-period SMA, and the upper and lower bands are the standard deviations of this.
- If the price touches the upper band, it can signal overbought conditions. Vice-versa the price touches the lower band, it indicates oversold conditions.
- Bandwidth can be used to measure the market volatility.
- Squeeze and expansion of bands can provide the entry and exit signals.
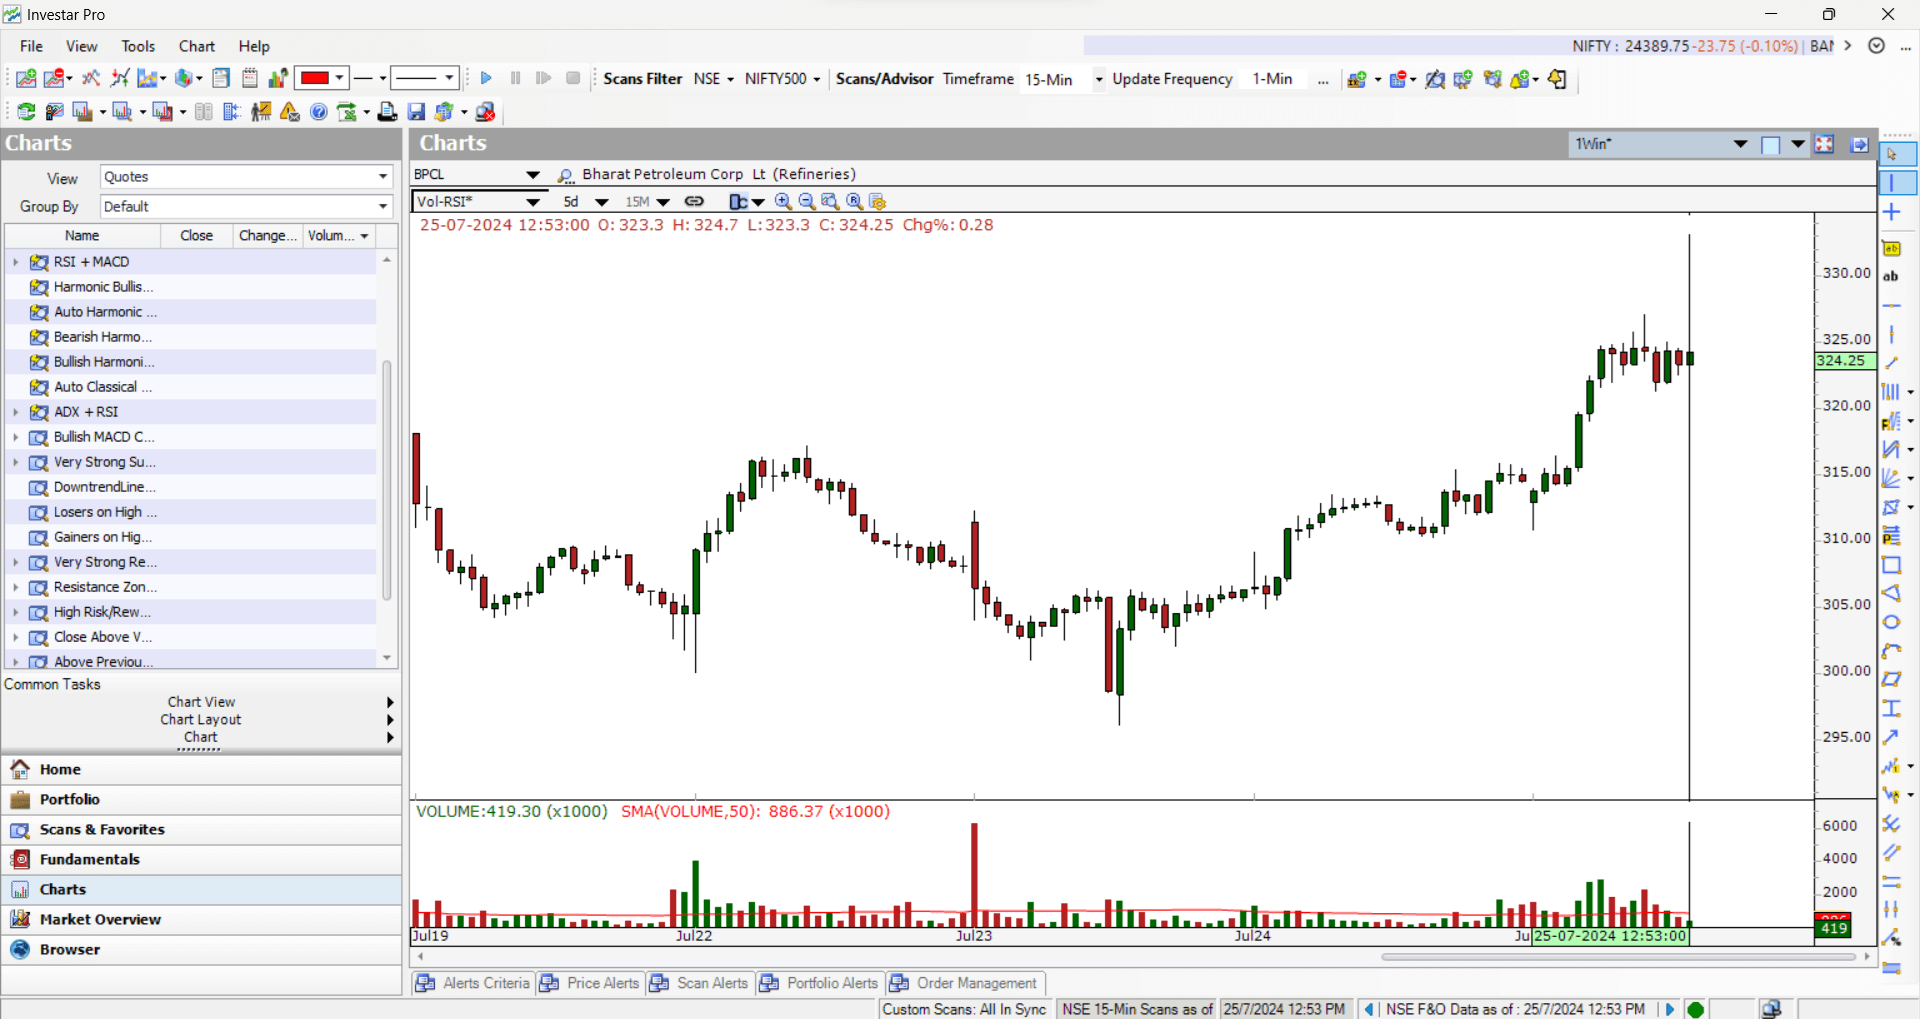
Moving Average Convergence Divergence (MACD):
- MACD is a popular indicator for intraday trading. It is a trend-following momentum indicator. You can see the relationship between two moving averages in MACD. There are 2 lines. One is the MACD line and the other one is the signal line.
- The 26-period EMA is subtracted from the 12-period EMA to get the MACD line. The MACD line’s 9-period EMA functions as the signal line.
- A bullish crossover occurs when the MACD line crosses above the signal line.
- A bearish crossover happens when the MACD line crosses below the signal line.
- This indicator can also be used in divergence trading.
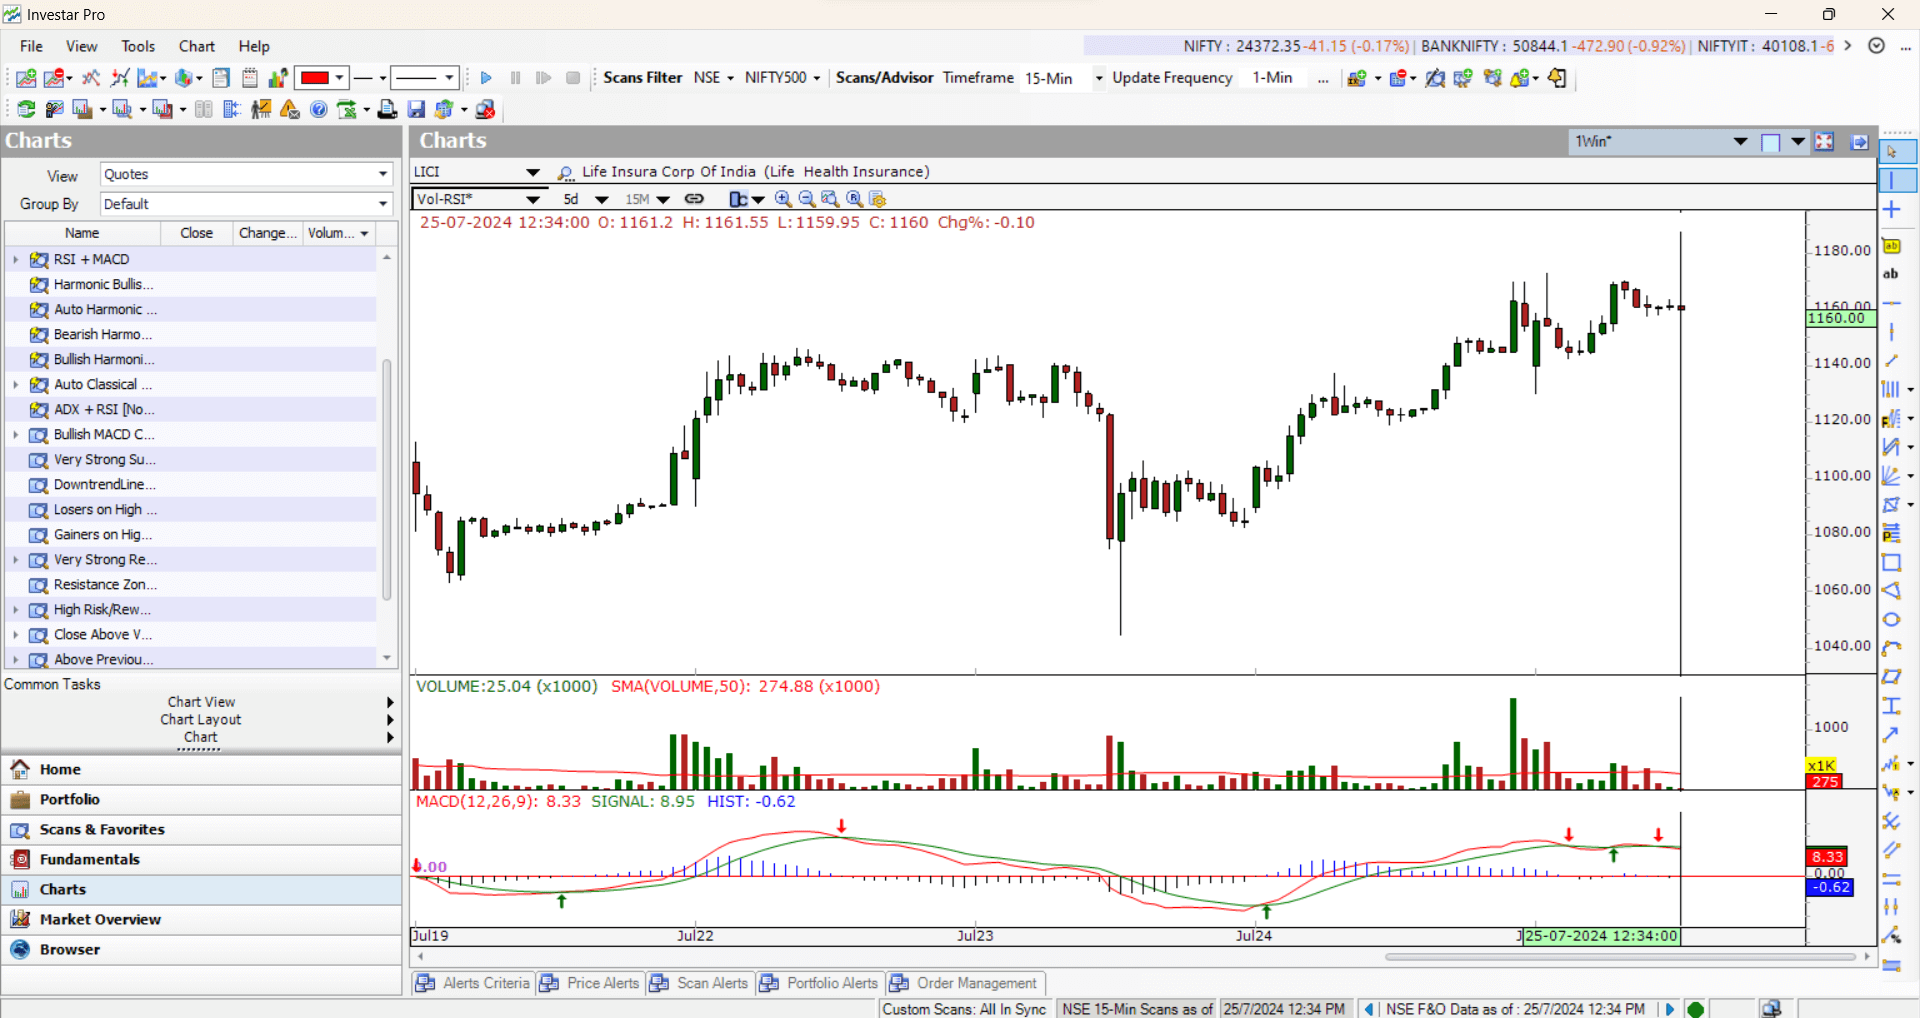
Volume:
- Generally, we ignore the volume part. But it is one of the most crucial indicators. It shows the number of shares traded in a specific period.
- High volume can confirm price breakouts. It means if the price gives a breakout and also the breakout volume is high, the trend will continue after the breakout.
- Low volume can indicate a weak trend or potential reversal.
- Also, the volume can be used to identify the accumulation and distribution phases.
Additional Best Indicators for Day Trading to Consider
While the above five are foundational, other indicators can enhance your intraday trading:
- Stochastic Oscillator: Measures overbought and oversold conditions.
- Parabolic SAR: Identifies potential trend reversals.
- Average True Range (ATR): Measures market volatility.
- Ichimoku Cloud: Provides multiple signals for trend, support, and resistance.
Cautions and Best Practices
- Indicator Lag: Remember that indicators are based on historical data, and therefore, there can be lag.
- False Signals: Indicators can generate false signals, especially in volatile markets.
- Over-reliance: Avoid relying solely on indicators; combine them with other analysis methods.
- Backtesting: Test your indicator strategies on historical data to assess their effectiveness.
- Risk Management: Always use stop-loss and take-profit orders to protect your capital.
Create Custom Scans with Indicators for Intraday Trading
If you want to get real-time stocks for intraday trading, you can create custom scans with your favorite indicators in Investar Software. After creating the custom, you need to save the scan. On the left, you will get the scanned stocks.
In Investar Software, you can easily plot these indicators on the charts. Many other premium features are also there. If you want to make a combination of indicators for intraday trading, you can also do that. We provide real-time data in Investar so that you can trade quite swiftly.