As traders, our mission is to uncover profitable opportunities in the stock market. Indicators play a crucial role in this endeavor, and one such powerful tool is the Relative Strength Index (RSI). A good RSI trading strategy can help to predict rising momentum, underlying demand or supply, and sentiment shifts. It even forecasts trends and reversals.
In this blog post, we’ll dive into five trading strategies that leverage the RSI. Maybe you are a novice trader or a professional. Don’t worry, these strategies can enhance your technical analysis and improve your trading strategy.
What is Relative Strength Index (RSI)?
The RSI was developed by J. Welles Wilder. It compares the strength of up days versus down days to determine how well a stock performs relative to itself. It provides a numerical value between 0 and 100. The readings above 70 show bullishness and readings below 30 show bearishness. Let’s explore how to use the RSI effectively.
How to Use RSI?
- Overbought/Oversold Levels:
- RSI above 70: Overbought
- RSI below 30: Oversold
- Adjust these levels based on the security’s behavior.
- Remember, during strong trends, RSI may stay in overbought or oversold territory for extended periods.
- Patterns and Trending Market:
- RSI often forms chart patterns (e.g., double tops, bottoms) not visible on price charts.
- Look for support or resistance levels on the RSI.
- Divergences:
- If prices make new highs or lows that RSI doesn’t confirm, it signals a potential reversal.
Now, let’s explore the four RSI trading strategies:
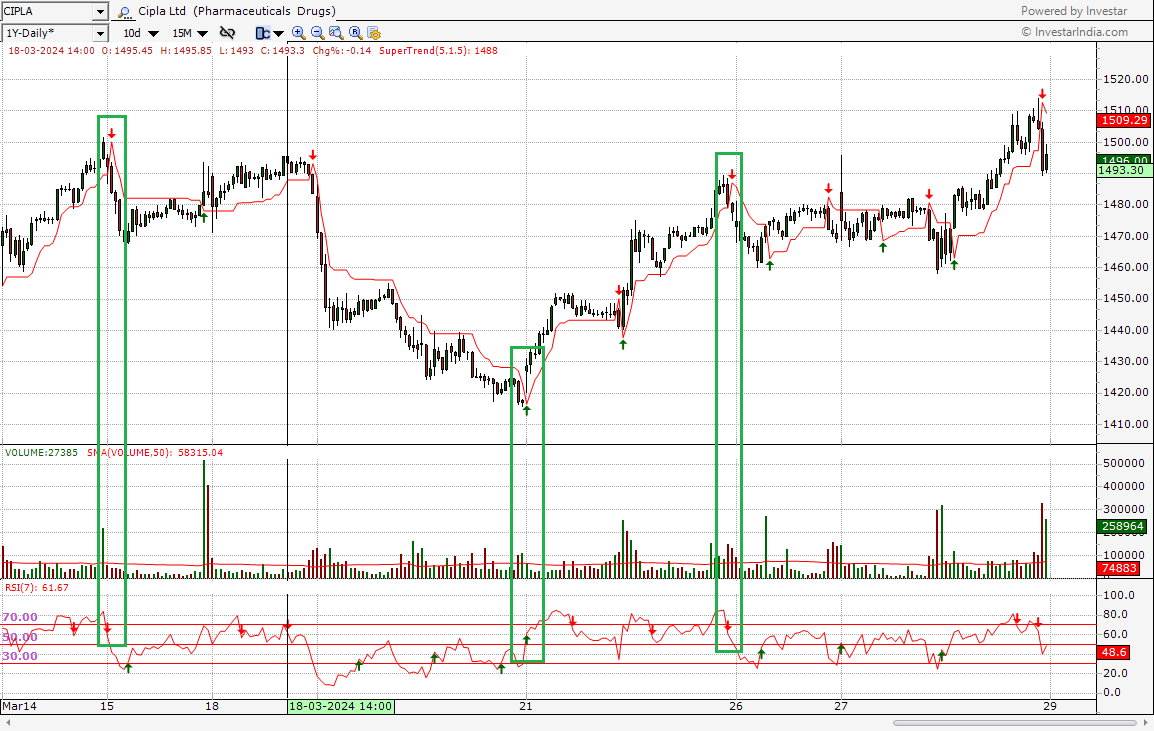
1. RSI with Supertrend:
The Supertrend indicator helps filter out false RSI signals, especially in volatile markets. Combining Supertrend(10,3) with RSI(14) yields less favorable outcomes. Conversely, pairing RSI(7) with Supertrend(5,1.5) produces intriguing results, effectively filtering out numerous false signals.
Strategy:
- Buy Signal: Initiate a Buy action upon receiving a Buy signal in RSI(7), succeeded by a Buy indication in Supertrend(5,1.5) within 2-3 candles.
- Sell Signal: Execute a Sell action upon obtaining a Sell signal in RSI(7), followed by a Sell indication in Supertrend(5,1.5) within 2-3 candles.
Check out our blog post on the Supertrend Indicator Strategy for comprehensive information regarding the integration of the Relative Strength Index (RSI) with the Supertrend indicator strategy.
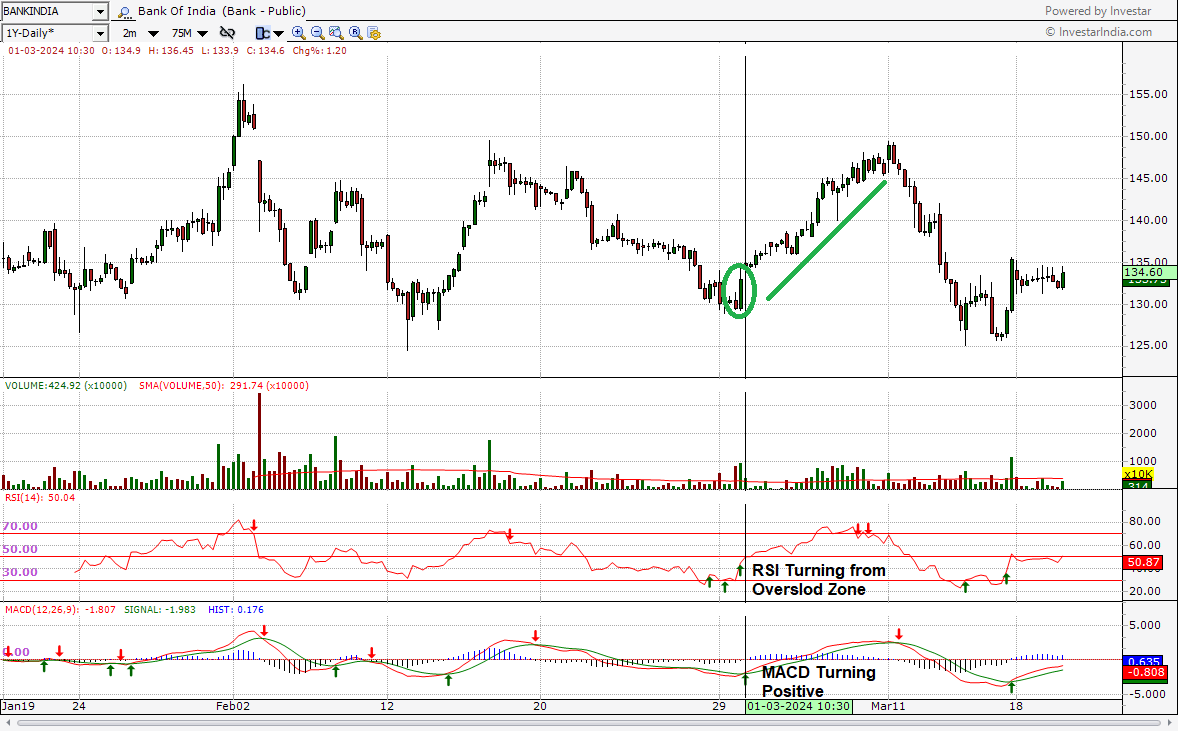
2. RSI with MACD
Overview: Combining the RSI with the Moving Average Convergence Divergence (MACD) can offer a robust trading strategy by leveraging momentum and trend confirmation.
Strategy:
Look for divergence between the RSI and MACD to identify potential trend reversals.
Use RSI levels to confirm MACD signals for buy or sell opportunities.
- Buy Signal: When RSI crosses above 50 and MACD lines are rising.
- Sell Signal: When RSI crosses below 50 and MACD lines are falling.
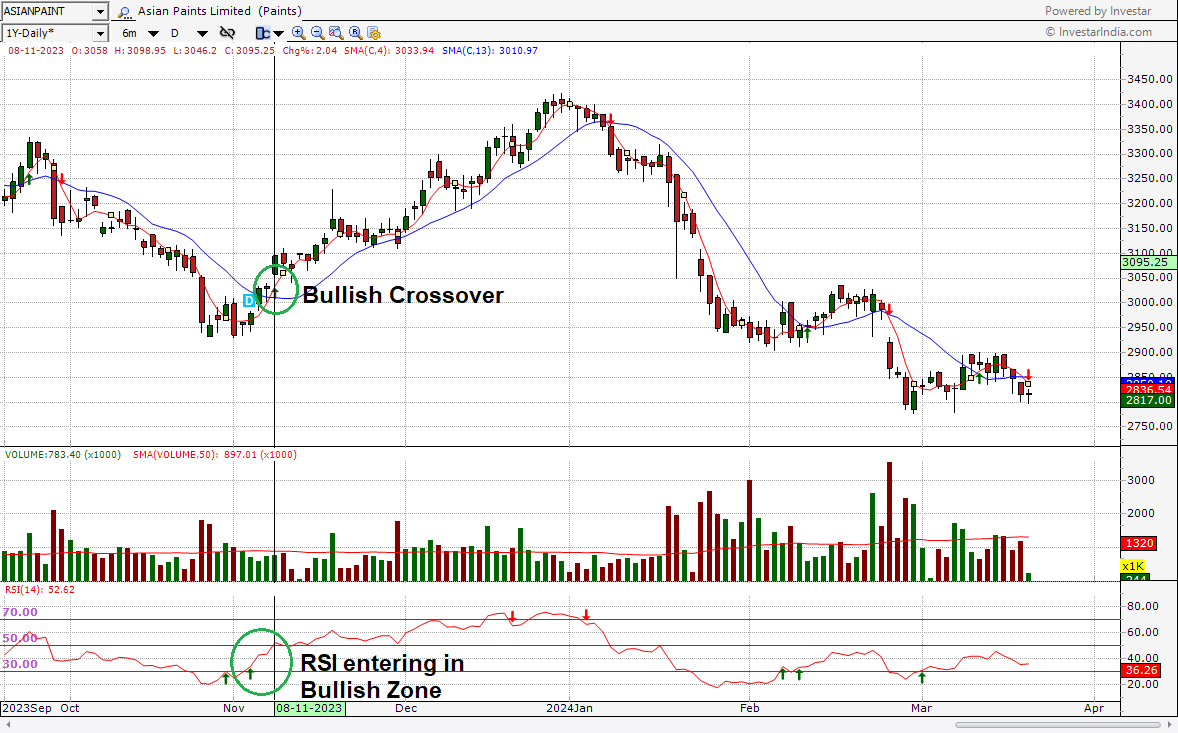
3. RSI with MA Crossover
Overview: Integrating the RSI with Moving Average (MA) crossovers can help traders identify trend changes and potential entry or exit points.
Strategy:
Combine RSI signals with MA crossovers to confirm trend direction.
Look for RSI divergence alongside MA crossover for stronger signals.
- Buy Signal: Identify an RSI bounce off oversold levels (around 30) followed by a price crossing above the chosen MA (e.g., 5 EAM & 20 EMA). This confluence suggests a potential uptrend.
- Sell Signal: Spot an RSI peak at overbought territory (above 70) coupled with a price dipping below the MA. This could signal a downtrend, hinting at a sell opportunity.
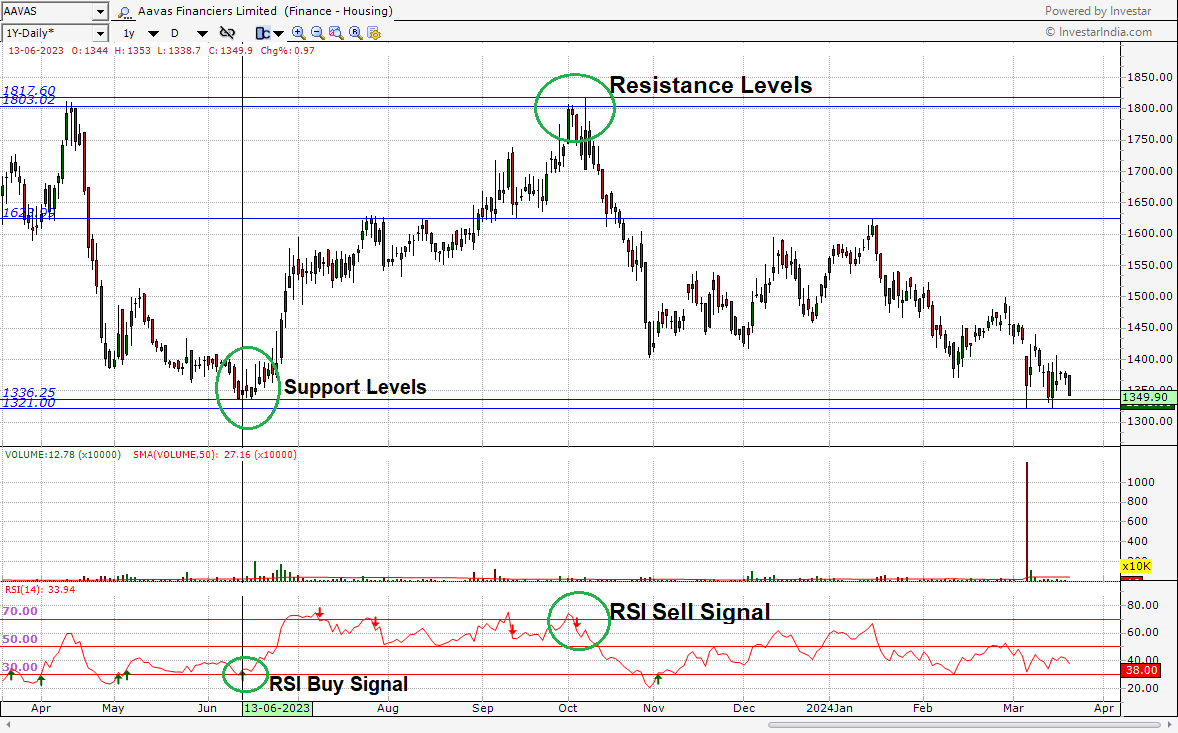
4. RSI and Price Action Trading
Overview: Price action trading relies on pure price movements without relying on indicators alone. Integrating RSI with price action analysis can enhance trading decisions.
Strategy:
Use RSI to confirm price action signals such as support and resistance levels.
Look for RSI overbought/oversold conditions alongside key price levels for potential reversals.
- Look for bullish reversal patterns (e.g., support levels, hammer, bullish engulfing) emerging at oversold RSI levels (below 30). This strengthens the potential for a price upswing.
- Identify bearish reversal patterns (e.g., resistance levels shooting star, bearish engulfing) coinciding with overbought RSI readings (above 70). This reinforces the possibility of a price decline.
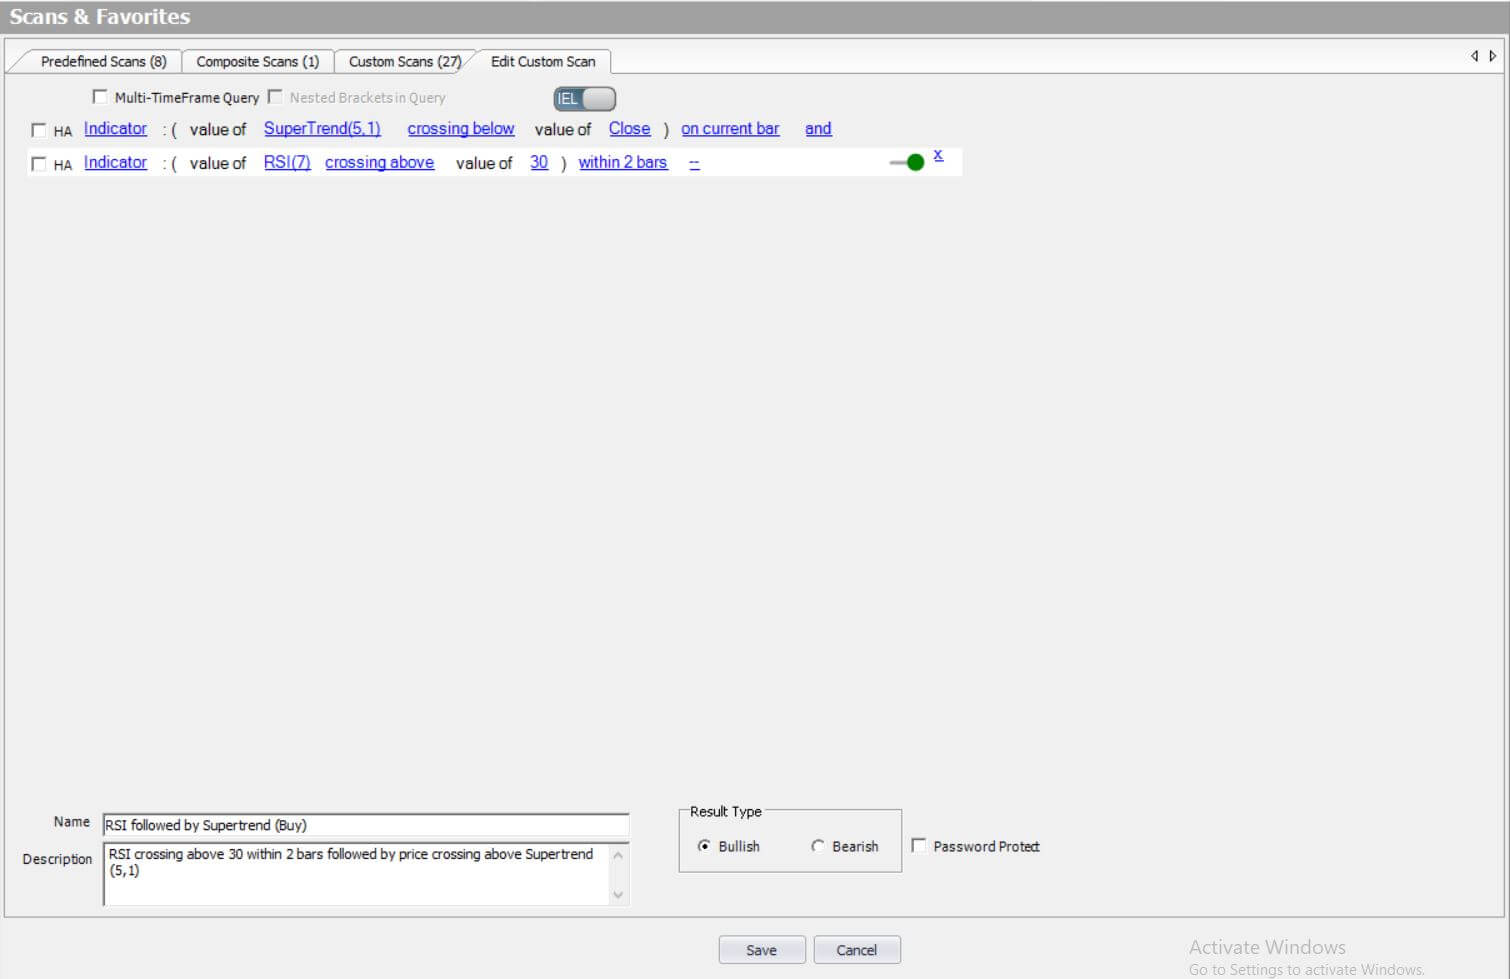
Easily create these strategies in Investar Software, using Custom Scans:
In Investar Software, we provide various custom scans. You can find your favorite stocks and implement your favorite trading strategy with the help of custom scans. Here we have created ‘RSI followed by Supertrend’ & ‘RSI follower by EMA crossover’ strategies.
You can also use predefined scans. After installing the Investar Software, you will get many amazing scans automatically.
Bottomline
Remember, no single strategy works all the time. Combine RSI with other tools, adapt to market conditions, and practice risk management. Happy trading!