In our previous blog post, we learnt how Price Action Strategy is one of the popular Swing Trading Strategies. We have already seen how to read price action, types of price action trading strategies (techniques) along with their benefits and drawbacks under Price Action Trading Strategies. Let us now deep-dive and see some profitable, and hence important price action patterns. First let us quickly revise what is price action and its importance.
What is Price action and why it is important?
If we observe price of a traded equity, as plotted on a chart over a particular period of time, we find it has moved up and down, and sometimes consolidated. This movement of a security’s price is termed as Price action.
Price action is important because trading decisions are taken based on various chart patterns and technical analysis which are derived from this Price action over a particular period of time. Simply put, price action from past period enables traders to take calculated risk.
Price Action Trading Patterns:
Price action trading patterns are of two types. One is Price action Bar patterns and the other is Price action Candlestick patterns.
Type A) Bar Patterns:
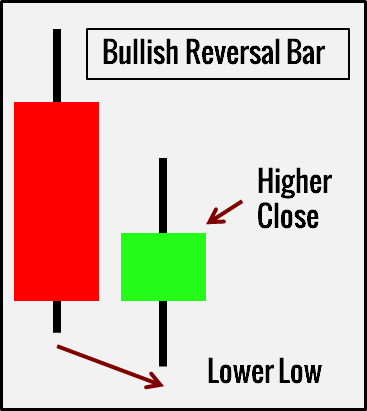
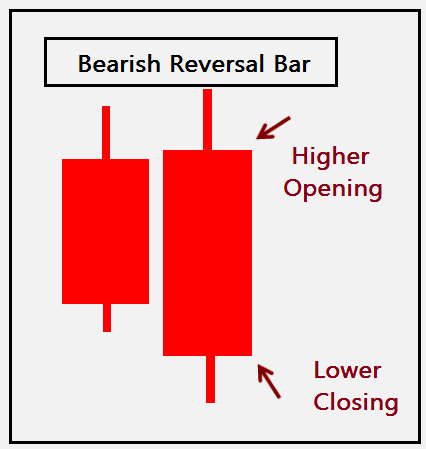
1) Reversal Bar
A bullish reversal bar pattern, before closing higher, goes below the low of the previous bar. For the bullish pattern, support is found below the low of the previous bar. Plus, the support is strong enough to push the bar so as to close higher than the previous bar. That’s the first sign which tells us of a possible bullish reversal.
A bearish reversal bar pattern goes above the high of the last bar before closing lower. For the bearish pattern to unfold, the resistance is seen above the high of previous bar. Also, the resistance is powerful enough which leads the current bar to close lower.
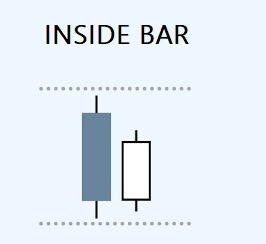
2) Inside Bar
An inside bar must be entirely within range of its earlier consecutive bar. In other words, the following bar must have a lower high and a higher low. An inside bar is a contraction in price-range/volatility. Within the same unit time, the market covers less ground and remains within the range of previous bar. It is a pause in price action and does not show clear strength in either direction.
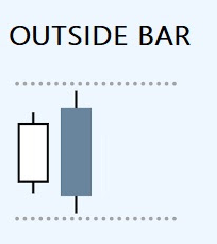
3) Outside Bar
An outside bar pattern is the opposite of an inside bar. Its range must exceed that of the previous bar with a higher high and a lower low. It is a short-term expansion in price-range/volatility. It shows strength in both directions. In most cases, it is uncertain whether the bulls have won or the bears have won. The only certainty is the increased volatility/ price-range.
4) Pin Bar
It is also known as Pinocchio Bar as it resembles the nose of Pinocchio. It has a long and distinct tail. For bullish pin bars, the lower tail takes up most of the bar. For bearish pin bars, it is the upper tail that dominates. With its long tail, a pin bar breaks a support or resistance momentarily to trick traders into entering the wrong direction. This is an opportunity to earn profits when you find trapped traders.

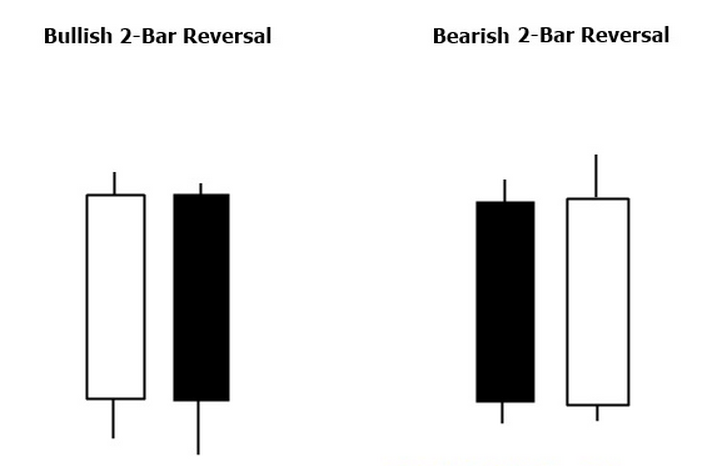
5) Two-Bar Reversal
The two-bar reversal technique is made up of two strong bars closing in opposite directions. A clear rejection of a downward thrust is a bullish reversal, and a clear rejection of an upthrust is a bearish reversal. In this case, the first bar represents the first thrust, and the second bar represents its rejection. The bullish variant consists of a strong bearish bar followed by a bullish bar. A reverse order means the bearish variant. Every reversal pattern works on the same premise.
Type B) Candlestick Patterns
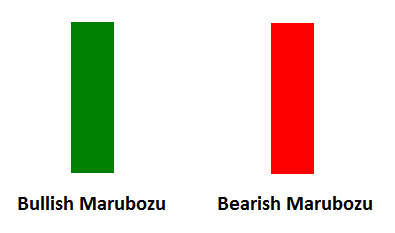
1) Marubozu
This is one of the two basic sentiment candlestick patterns (the other being “Doji”). Opposite of a Doji, it looks like a block, where opening price and closing price are at extreme ends of the candlestick. A Marubozu candle, closing higher than previous candle, indicates powerful bullish strength; while the one that closes lower shows extremely bearish sentiment.
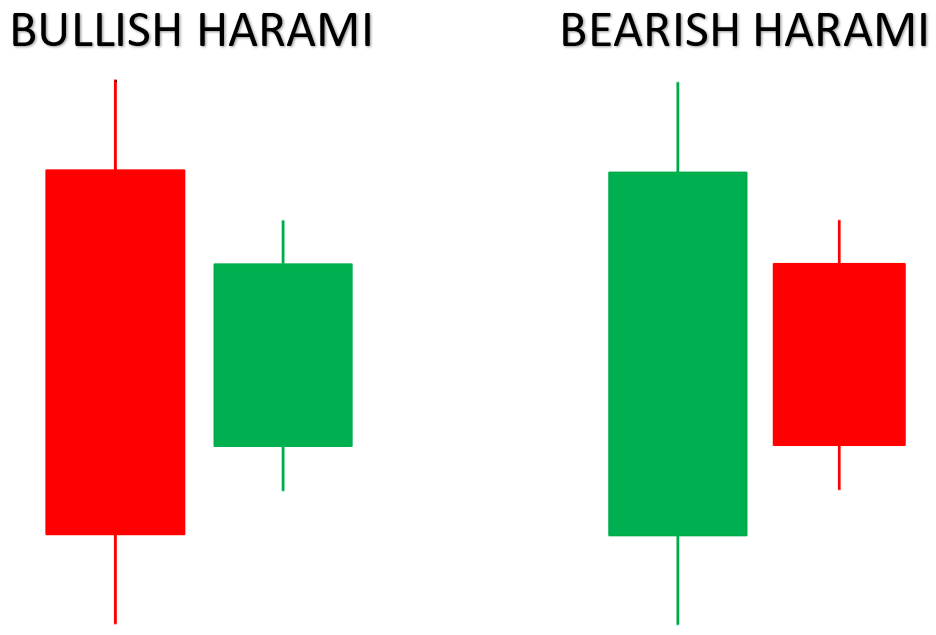
2) Harami
As the word means in old Japanese language, Harami means pregnant. In this pattern, the second candlestick which is resembled as a baby, must be entirely within the body of the first candlestick, which resembles a mother. Typically, in a bullish Harami, the first bar closes lower than it opens while the second bar closes higher. Similarly, in a bearish Harami, the first bar closes higher than it opens while the second bar closes lower. The smaller candle bodies point to decreased volatility. Thus, we can see that many Harami candlestick patterns are also inside bars.
3) Engulfing
If we interchange the candles in a Harami pattern, then an Engulfing pattern will emerge. The body of the second candle completely engulfs the body of the first candle.

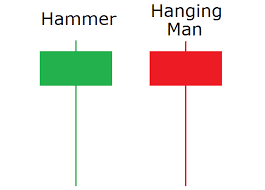
4) Hammer / Hanging Man
Both the Hammer and the Hanging Man candlestick patterns look just the same. They both have candle body towards the top of the candlestick; and a long lower shadow (approximately twice the length of the candle body).
The difference is this. The Hammer pattern is found after a market decline and is a bullish signal. However, the Hanging Man appears at the end of a bull run and is a bearish signal.
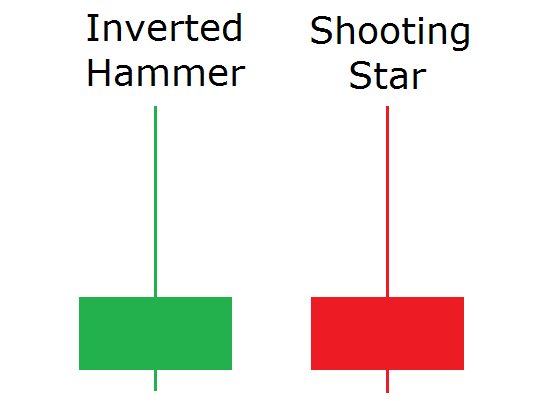
5) Inverted Hammer/ Shooting Star
As the name suggests, it’s the inverted hammer pattern which is identical to Shooting Star candlestick pattern. The difference between them is where they are placed. An Inverted Hammer, as a bullish pattern, is found at the end of a downtrend. On the other hand, a Shooting Star is found at the end of an uptrend.
The stock movement is based on past performance and future predictions. Thus, due to price movement, the stock market is said to be a highly unpredictable playground, where a systemic method or strategy or approach cannot be applied. Still, price action trading is believed to a reliable tool, better suited for short-to-medium term trades. But its extent depends on how you employ it.
In order to use price action techniques easily, Investar’s Price Action category in the Custom Screener, offers feature which enables users to customise and create more sophisticated Price Action based strategies.
Hope today’s post was a step further in your trading journey. Keep a tab on this space for more such exciting topics to support your stock market learning path.
Very good sir thanks
Glad you found it useful!