Money Flow Index (MFI) is an oscillator that uses price and volume to quantify buying and selling pressure. It uses a formula similar to RSI and hence it is also called as volume-weighted RSI. The formula uses the typical price of a stock and its volume to calculate the positive money flow and negative money flow, and then uses the accumulated positive and negative money flows over the period of the indicator to calculate the Money Flow Index.
Like RSI, Money Flow Index is also a leading indicator in nature and the use of volume in the mix makes it even more leading.
So, how is the Money Flow Index used?
Money Flow Index can be used to detect the overbought and oversold levels just like RSI. A level above 80 is considered overbought and a level below 20 is considered oversold. Like all indicators however, an overbought level does not mean that you should sell. Ideally, one should combine this with another indicator or method to confirm the Buy/Sell signal. This is because, like RSI, it tends to generate a lot of overbought signals during an uptrend and likewise oversold signals during a downtrend.
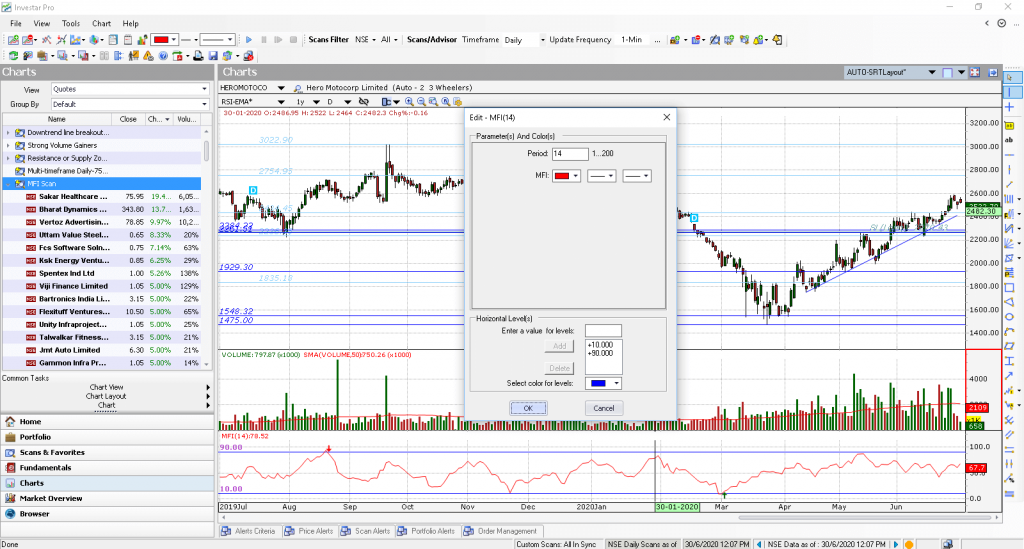
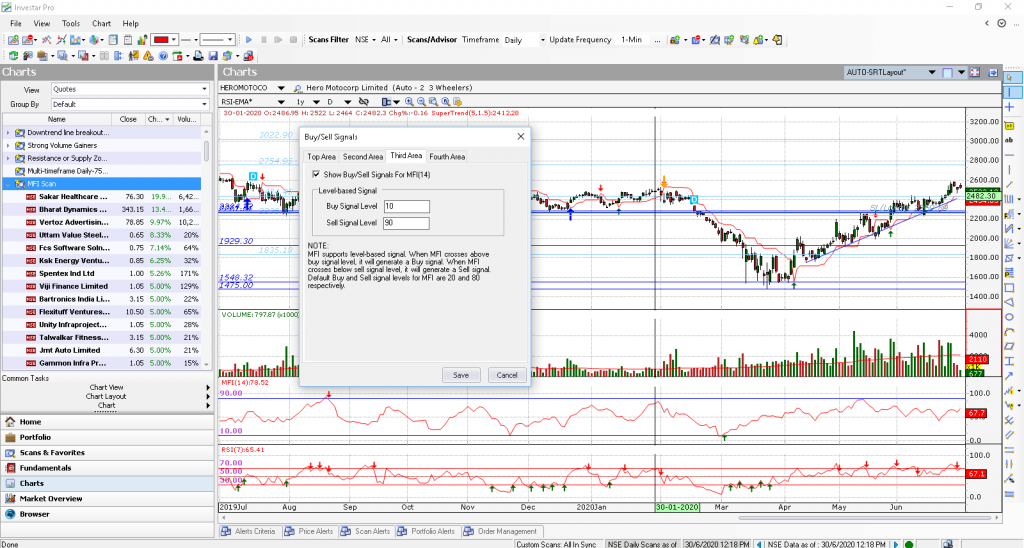
Many times, Technical Analysts use 90 and 10 levels instead of the default levels to find extreme overbought and oversold conditions. You can change the default levels and Buy/Sell signals settings in the MFI as follows in Investar:
Price-MFI Divergence
Another way to use the Money Flow Index is to detect trend reversals with Price-MFI divergence just like Price-RSI Divergence as explained in this article.
A Bearish Divergence occurs when the price is going up and the MFI goes down. This indicates that the price trend may reverse and start going down. A Bullish Divergence occurs when the price is going down and the MFI goes up. This indicates that the price may reverse and start going up.
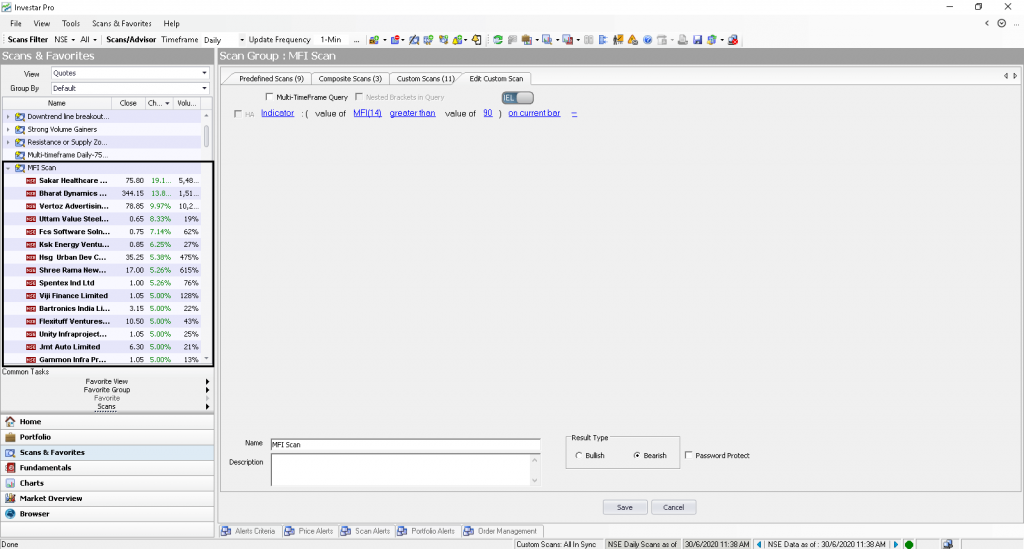
MFI Custom Screener
If you wanted to scan for MFI reaching overbought level of 90, you can do so by creating the custom scan in Investar:
A similar custom scan can be created for filtering the stocks with oversold MFI.


