Drawing Tools Features (Broker connectivity required for Intraday)
Investar comes with over 35+ specialized drawing Tools that can be added easily by accessing them in the drawing toolbar.
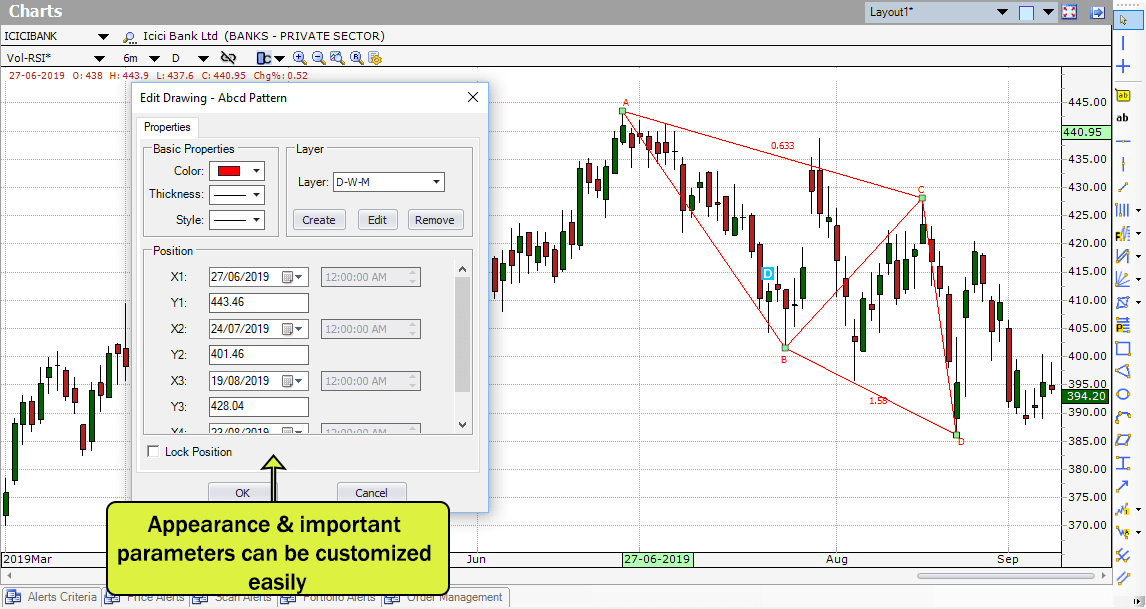
Investar offers a complete set of tools for Technical Aanalysis that can be added to the chart. If you navigate away from the chart, and come back later the drawings will still be available. All the basic properties such as Color, Thickness of drawing tool, Style or Postion or even Layer can be controlled by using the simple editing panel.
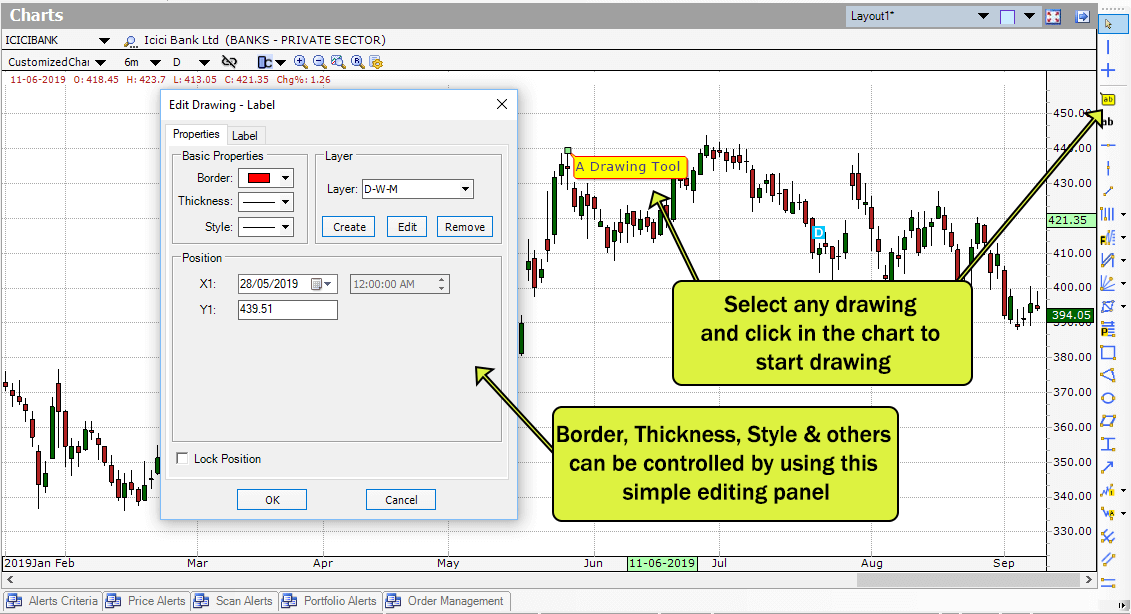
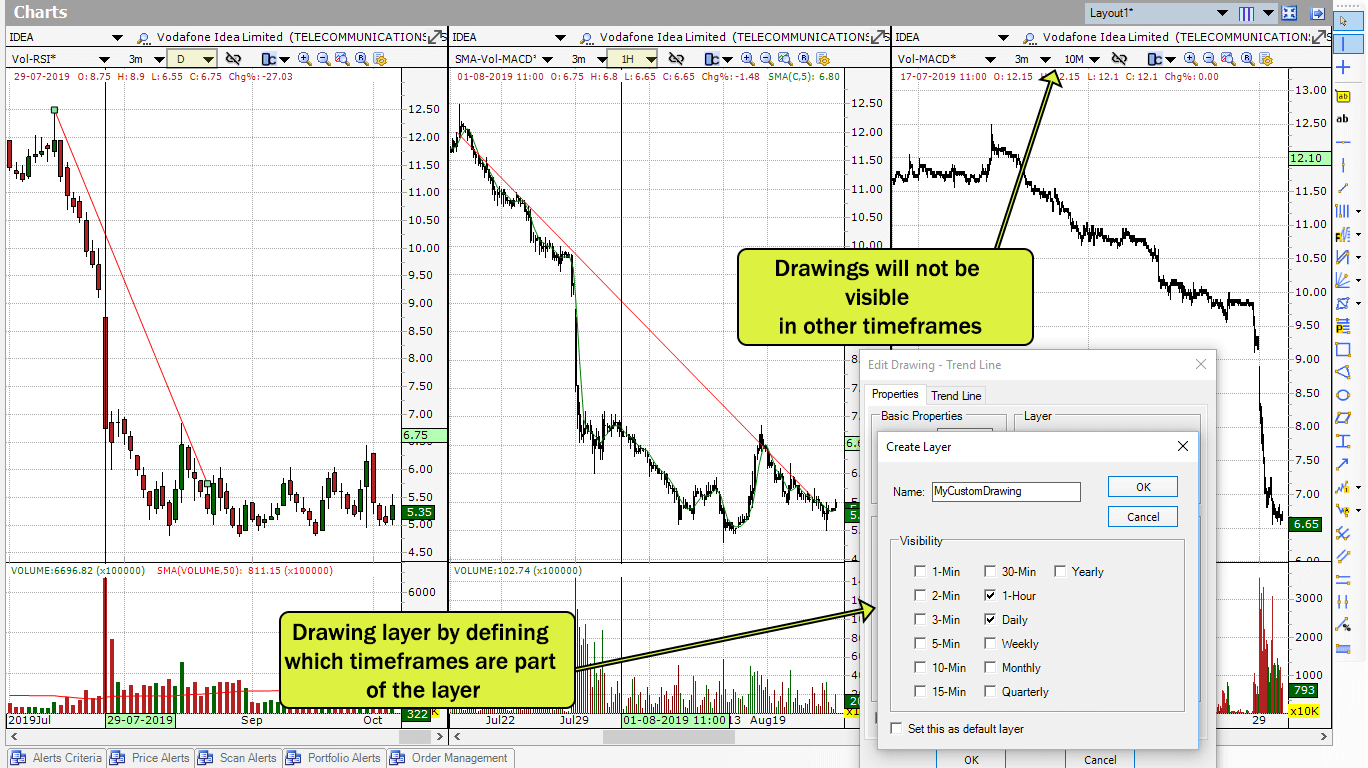
Drawings can be configured to be drawn in specific layers that can be customized to consist of specific timeframes.
Default layers are D-W-M for Daily and higher timeframes.
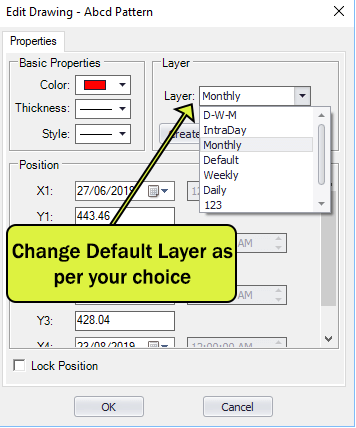
You can also create your own drawing layer by defining which timeframes are part of the layer (e.g. Daily and 1-hour). Once you do this, any drawing that you draw in one timeframe (e.g. Daily) will be automatically visible in all other timeframes in that layer (e.g. 1-hour).
Fibonacci
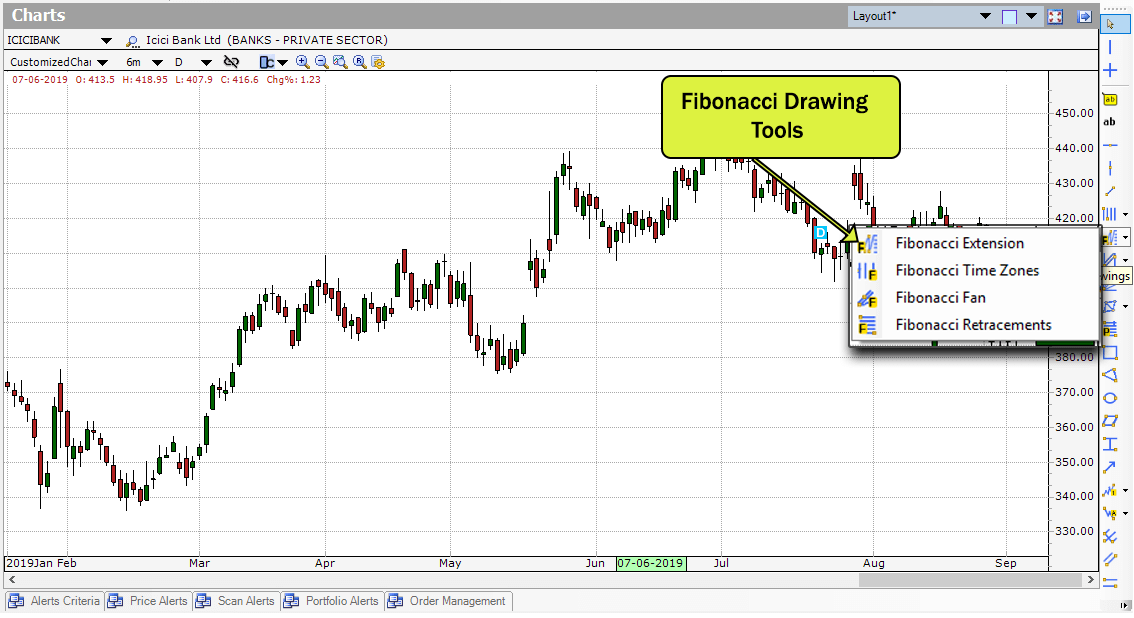
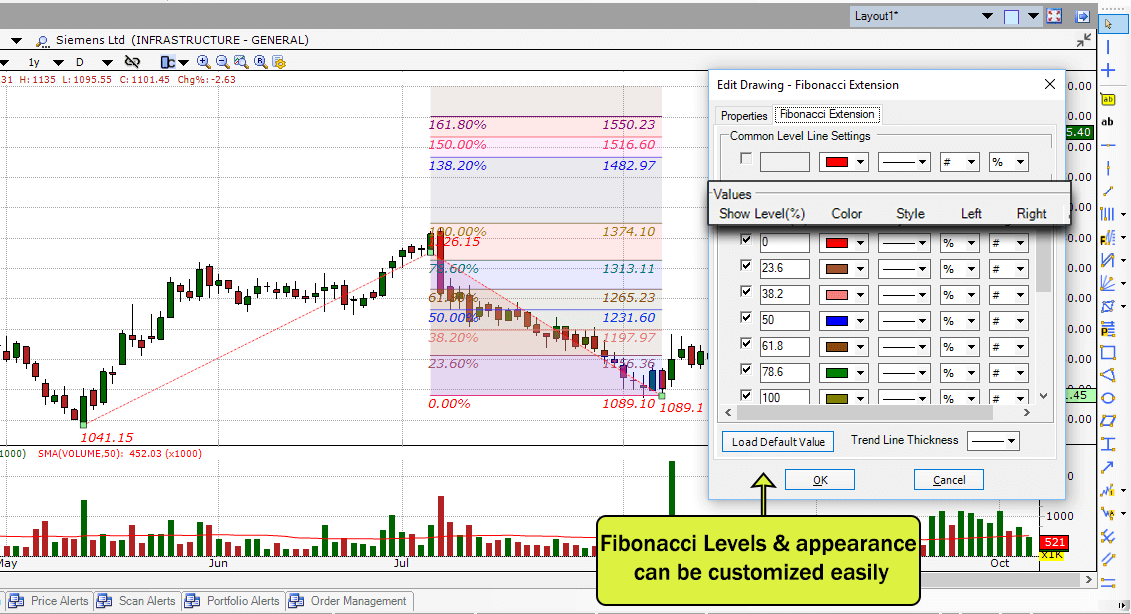
Popular Fibonacci drawing tools like Fibonacci Retracements, Fibonacci Extensions, Fibonacci Fans and Fibonacci TimeZones can be added to identify potential support/resistance levels.
Gann
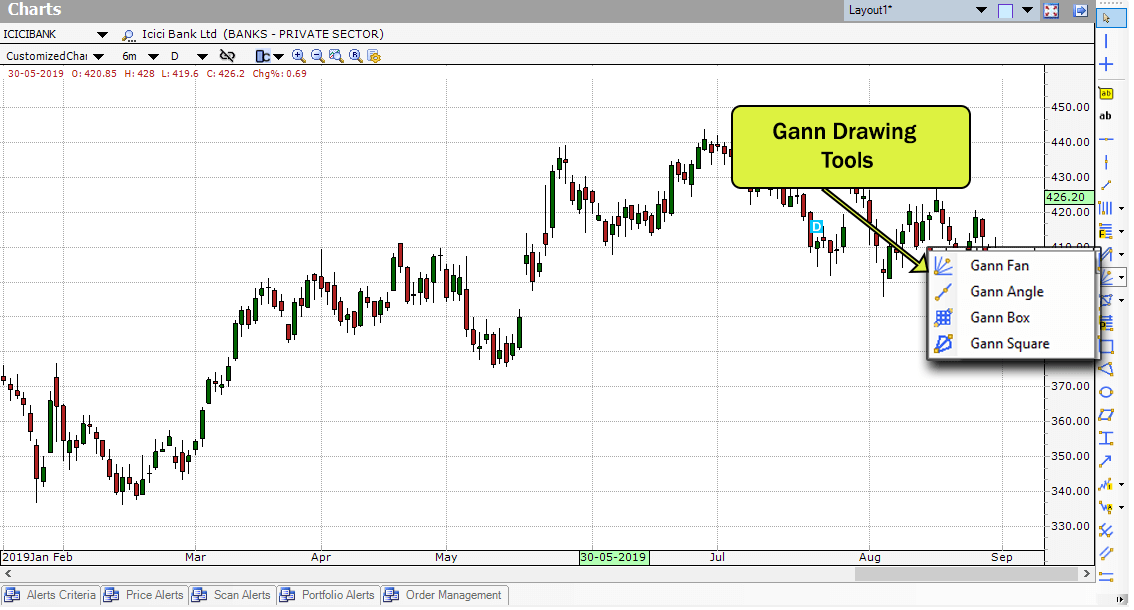
Popular Gann drawing tools like Gann Fan, Gann Angle, Gann Box and Gann Square can be added to the chart.

Harmonic Patterns
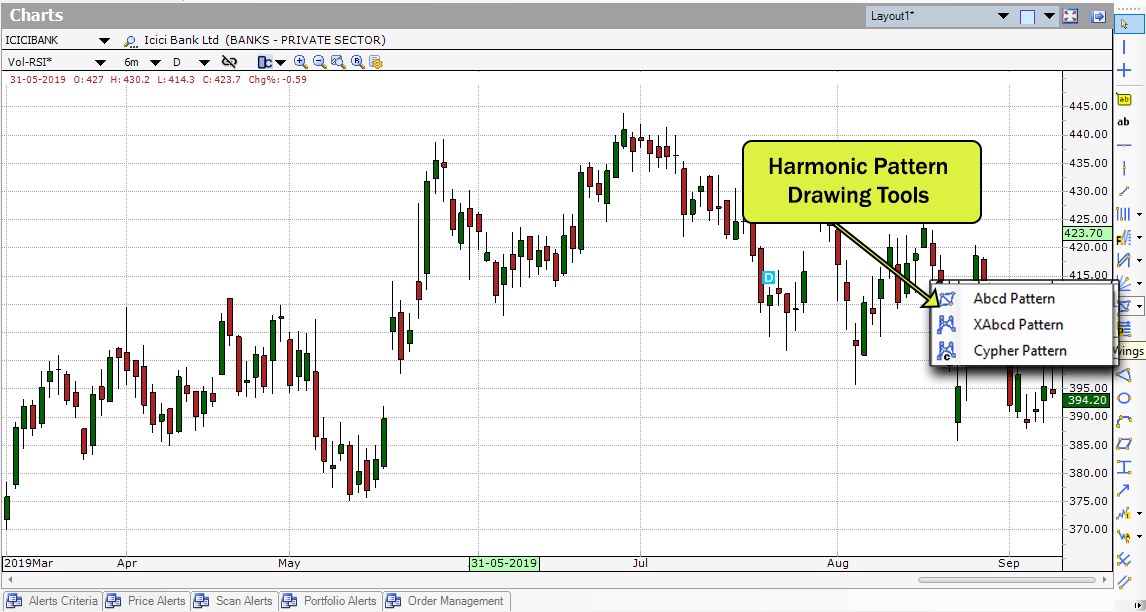
Harmonic Patterns can be easily detected on the chart with tools that simplify the drawing of various Harmonic Patterns like Abcd, Xabcd and Cipher Pattern tools.
