Spread Charts
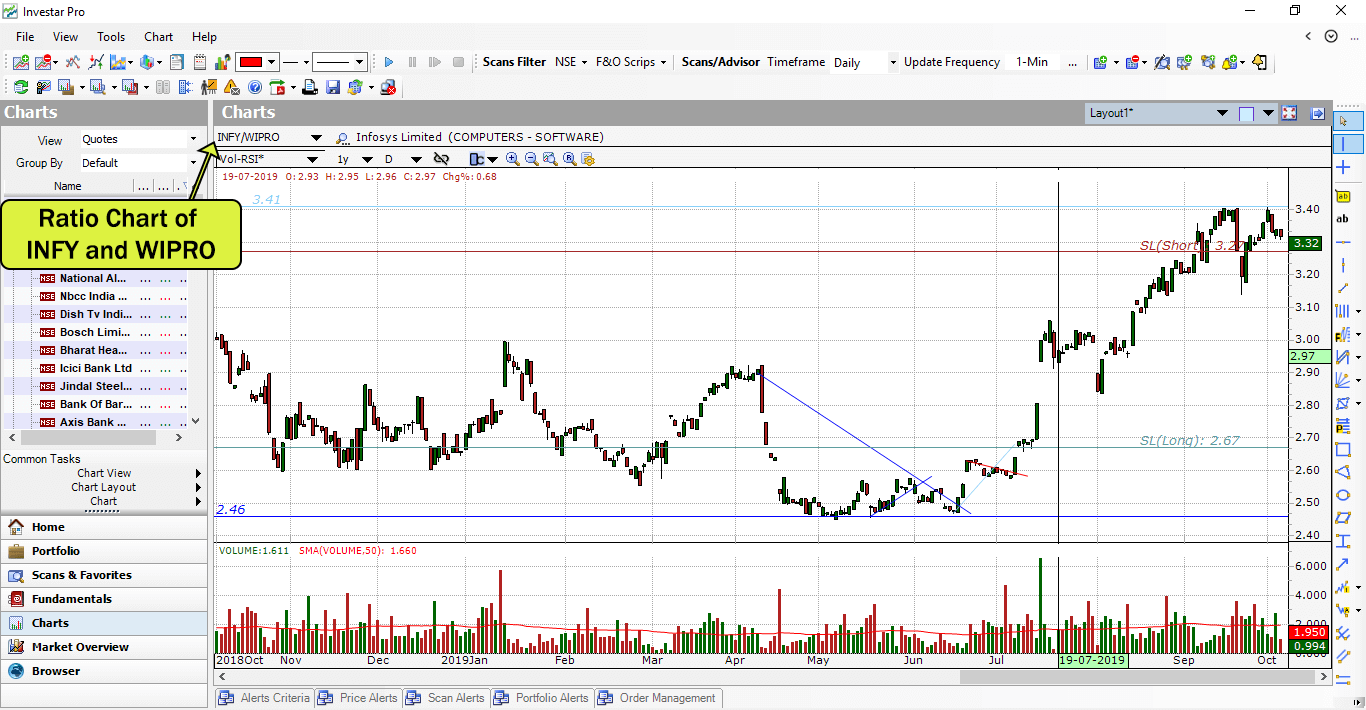
Investar supports all types of Spread Charts (including Ratio Charts). Any spread chart can be plotted easily using the spread operators '+', '-' and '/'.
You can plot the relative performance of one symbol compared to the other by simply typing the two symbols separated by a '/' operator. e.g. INFY/WIPRO
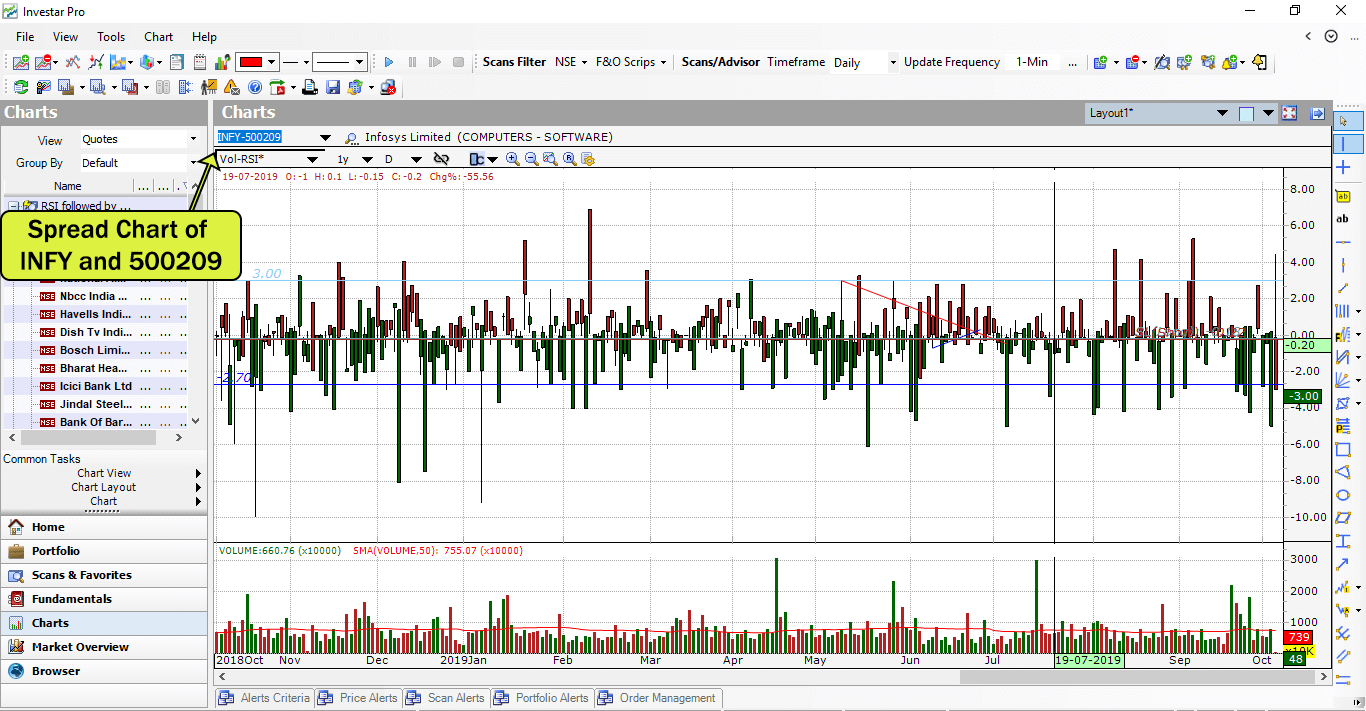
You can identify arbitrage opportunities by plotting the difference of prices of a scrip trading in two different exchanges by simply using the '-' operator between the two symbols. E.g. INFY – 500209 to plot the difference between prices of Infosys between NSE and BSE.
Multiple scrips
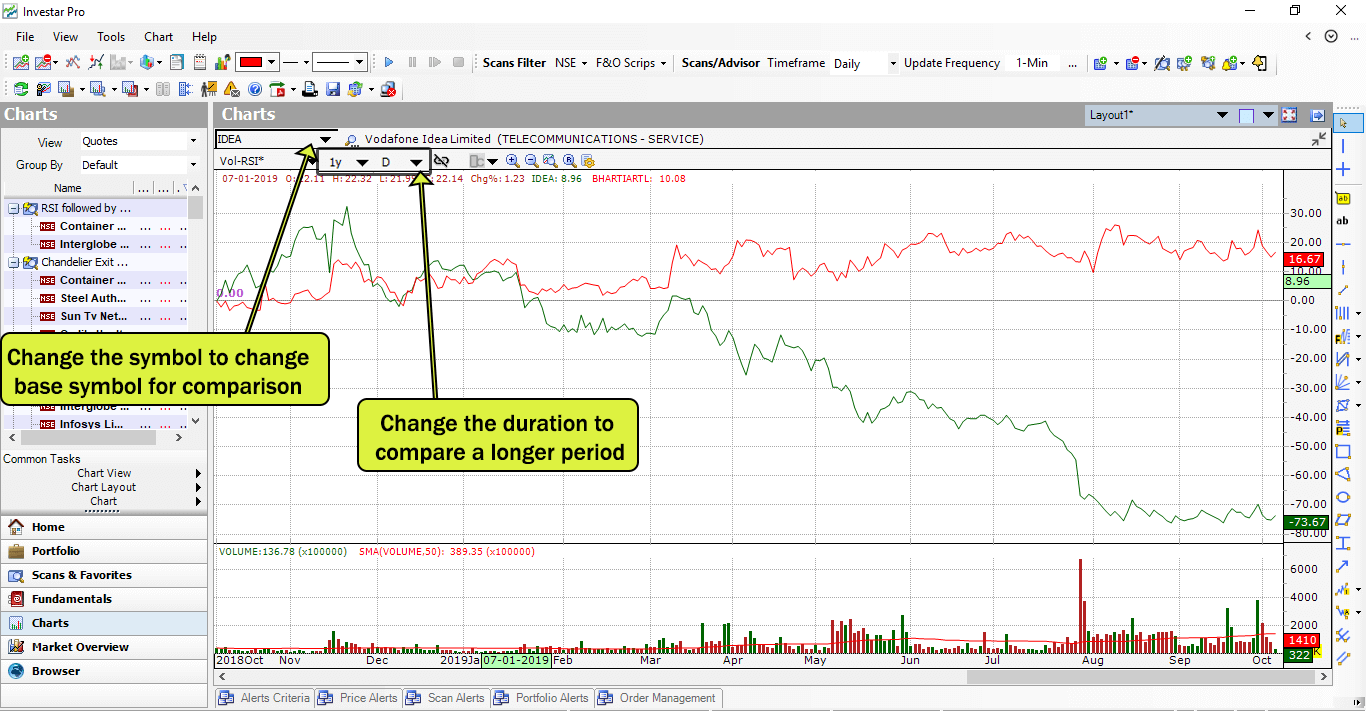
Historical Performance of Multiple scrips can be compared easily in Chart Comparison mode.
You can add upto 4 scrips to any chart to compare the performance and they are compared relative to the base scrip starting from 0% at the very beginning of chart.
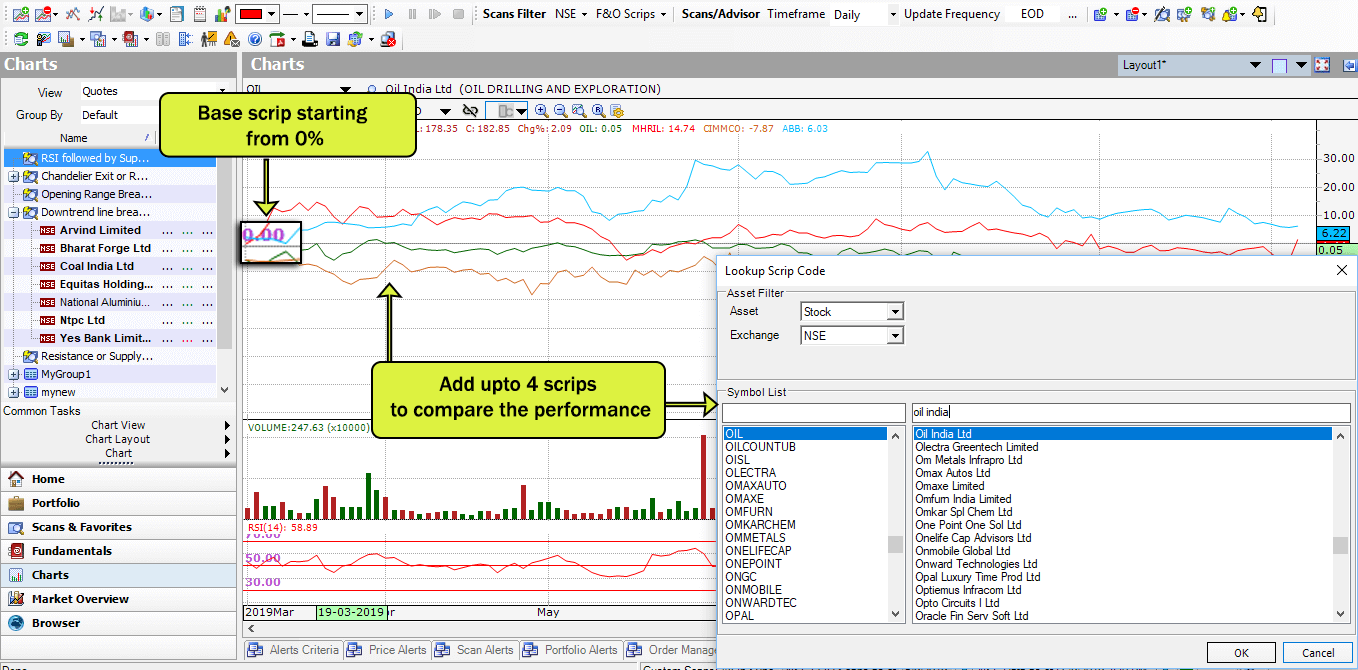
You can change the duration to change the starting point of comparison as well as you can also Change symbol to change the base scrip.