Volume is one of the simplest indicators in Technical Analysis but when used properly it is also one of the most powerful confirmatory indicators out there. It’s all the more important in the current market. In this thread, we’ll take a detailed look at volume with examples.
Volume is the total no of shares that are bought/sold. Huge volume can be associated with accumulation/distribution by FIIs, while small volume can be associated with retail investors. When Price Action is combined with volume, you get some interesting Price Volume patterns.
If Price goes up with increasing volume, that’s a sign that big guys are accumulating, hence, a Bullish sign. When Price goes down with declining volume, that’s a sign that the small retail investors are exiting. Nothing to worry, again a Bullish sign.
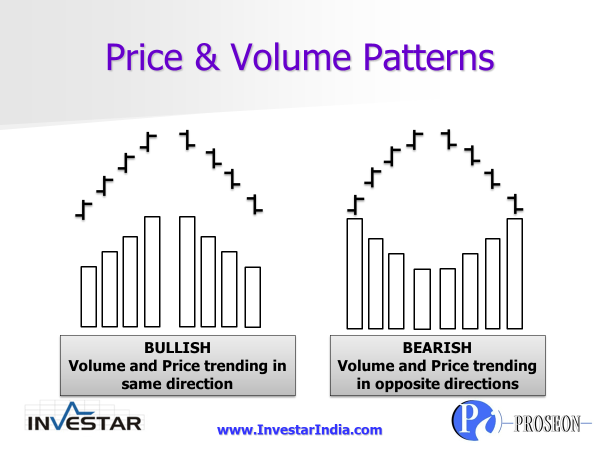
Similarly, if Price goes down with increasing volume, that’s a sign that big guys are exiting the stock, hence, a Bearish sign. When Price goes up with declining volume, that’s a sign that the small retail investors are entering. Not a good sign if you are holding the stock.
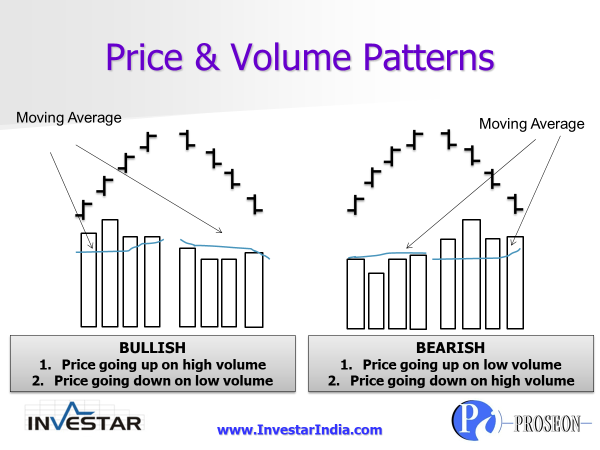
Price Volume Patterns cannot be so perfect of course, so in reality what you get is something as below. Here, moving average can be a 50-SMA on Volume. Hence, e.g., Price going up on above average volume is Bullish and Price going down on above average volume is Bearish.
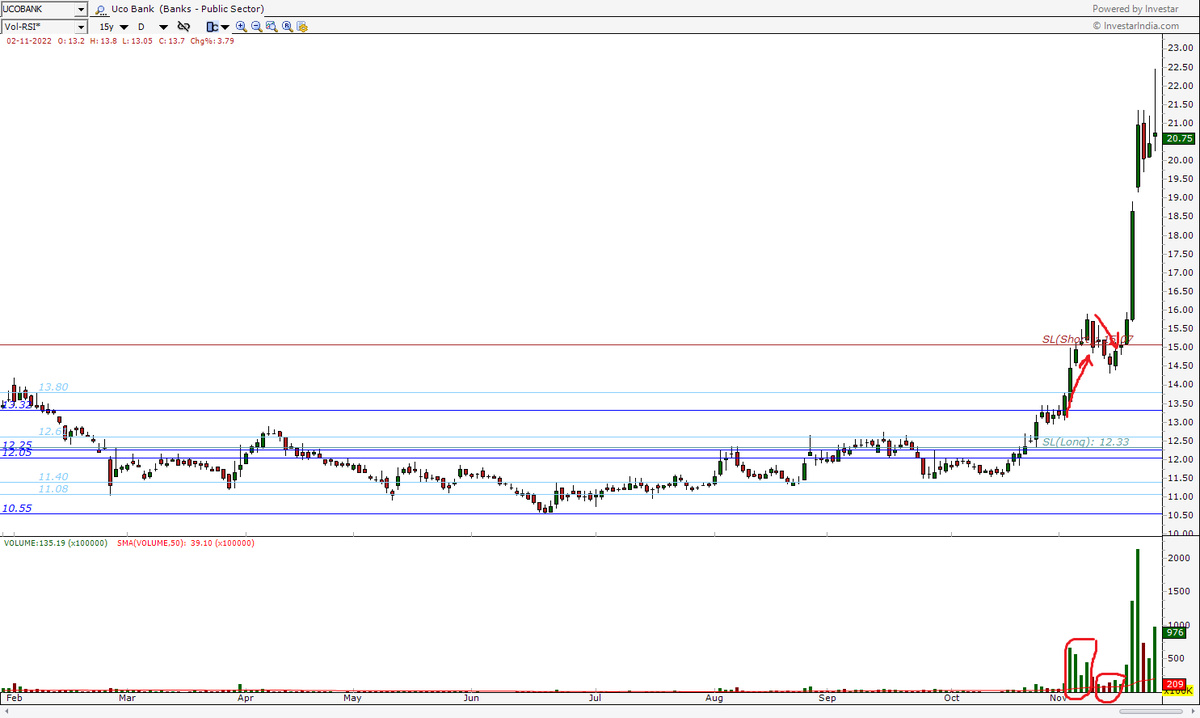
Now let’s look at some recent examples. UCOBANK had both the bullish patterns, and is up 80% from its breakout point of 13.8. The first one when breaking out indicated a very strong breakout, 2nd one while correcting on low volume confirmed the strong bullish trend.
Finally, a bearish pattern. I love to use PayTM , but based on the price action in last 2 weeks, I wouldn’t even touch the stock with a 10-foot pole.It’s down big on heavy selling from very strong support at 510, and is probably going to take weeks if not months to recover!

In PayTM ‘s case above, we can see that the selling is happening on heavy Delivery Volume also (which excludes intraday volume). It’s good to use it in liu of just Volume, in case you are using Daily timeframes and higher.
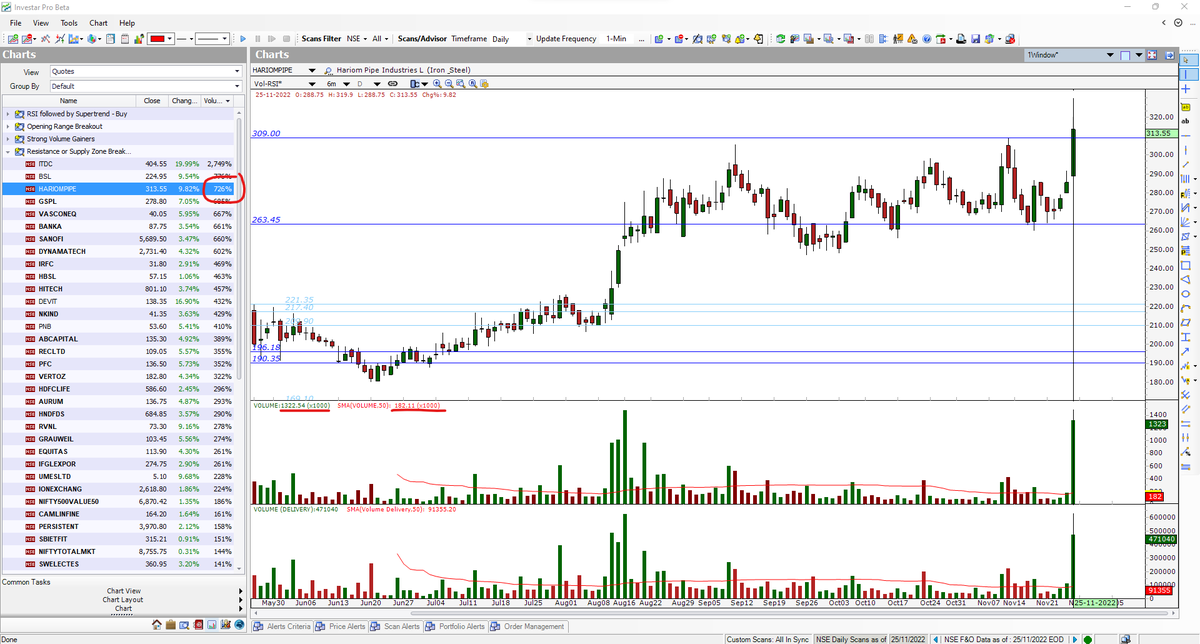
Finally, we consider Volume to be so important in Technicals, that we have another indicator in @investarindia, Vol%, which gives the Volume as a % of Average Volume. e.g. in the Auto-Resistance breakout scan below, HARIOMPIPE broke out on 7.26x average volume (1322/182).
If you want to learn more in-depth about how to use volume, see this Youtube video: