We are pleased to announce a new release of Investar Beta with support for Auto-Classical Pattern Scans.
Auto-Classical Pattern Scans
As you know, a few months back, we had announced the Auto-Classical Patterns feature which detects all major Classical Patterns on visiting any Chart. But, what if you wanted to know which Classical Pattern is forming on which stock or future? It is not possible to go through each and every stock in 2000+ stocks in NSE to see if it has a Classical Pattern formation. The Auto-Classical Pattern Scans feature makes this a breeze.
You can now scan all NSE stocks or Futures for to see if “Any Bullish” Classical Pattern is getting formed in the Daily timeframe as follows:
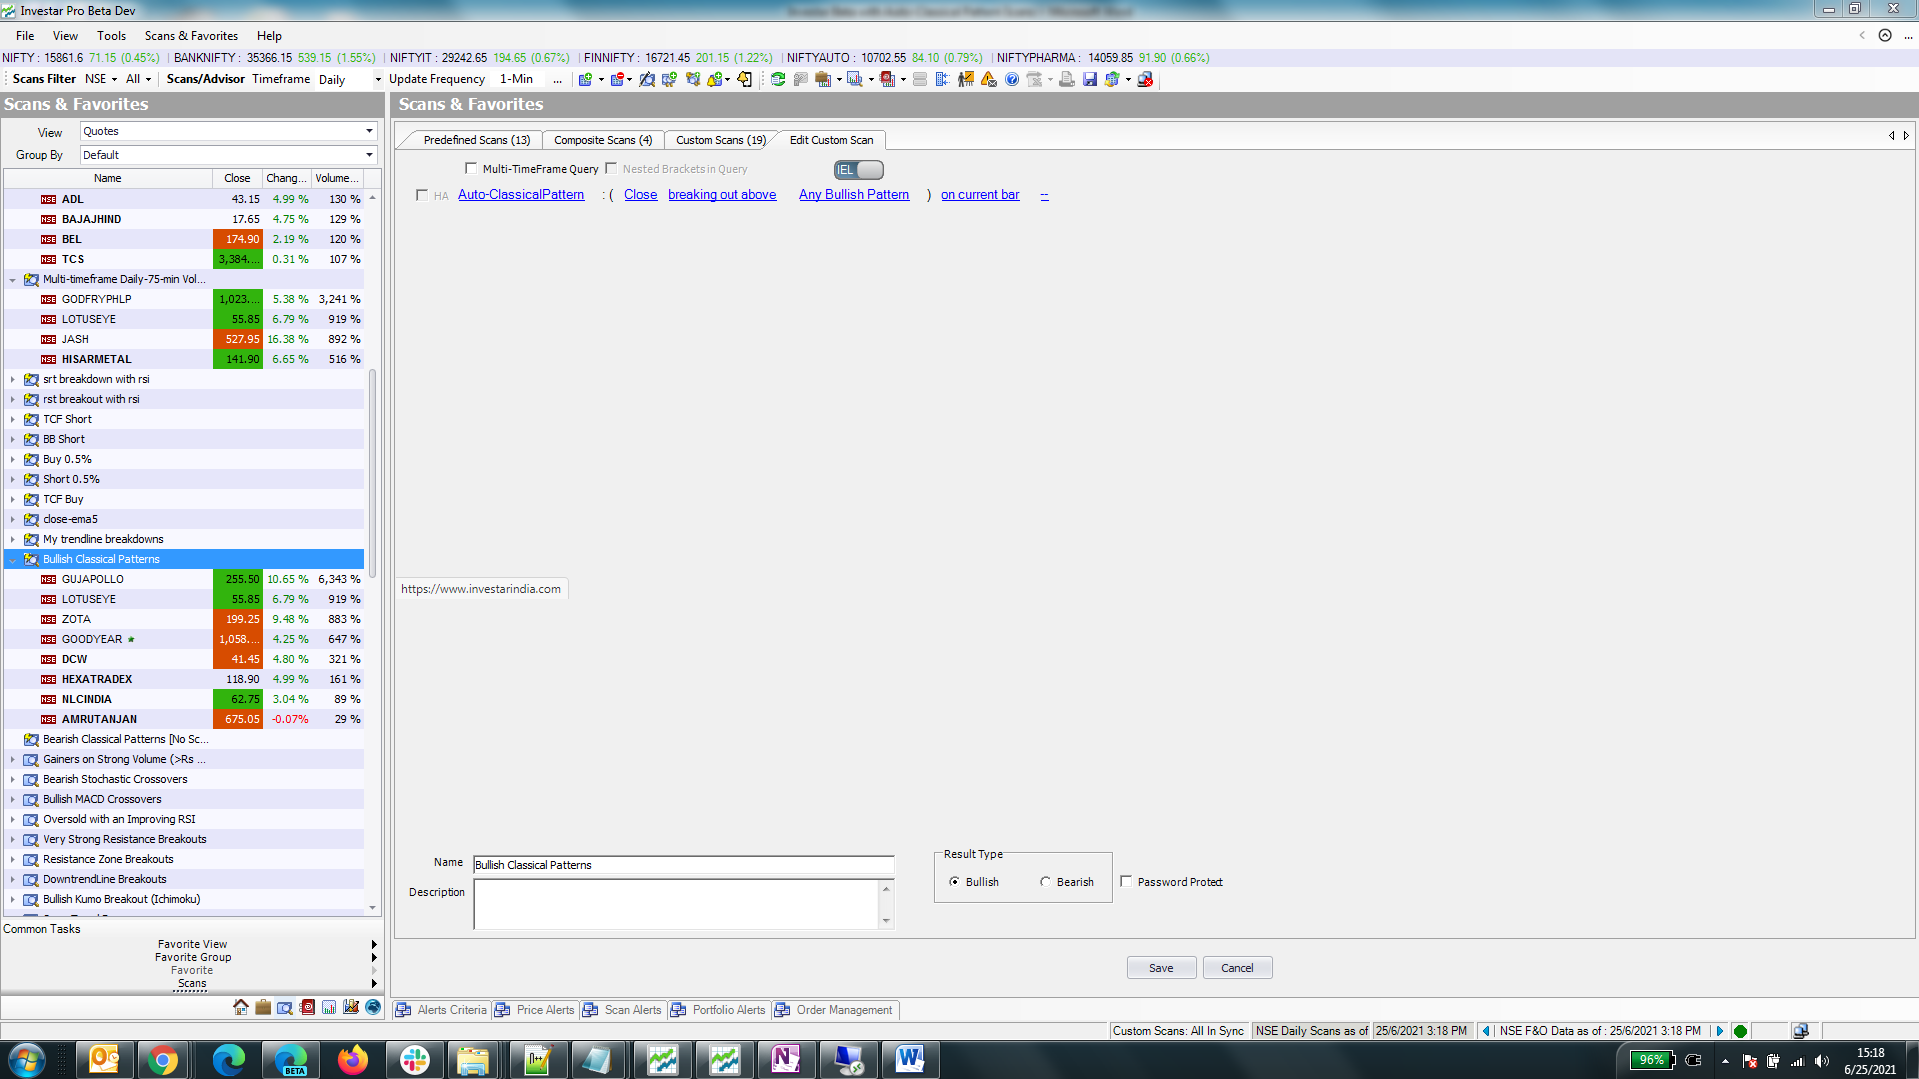
The above scan will show any stock that is breaking out of any Bullish Classical Pattern. As soon, as the computation is done, the scan shows the results in a split second.
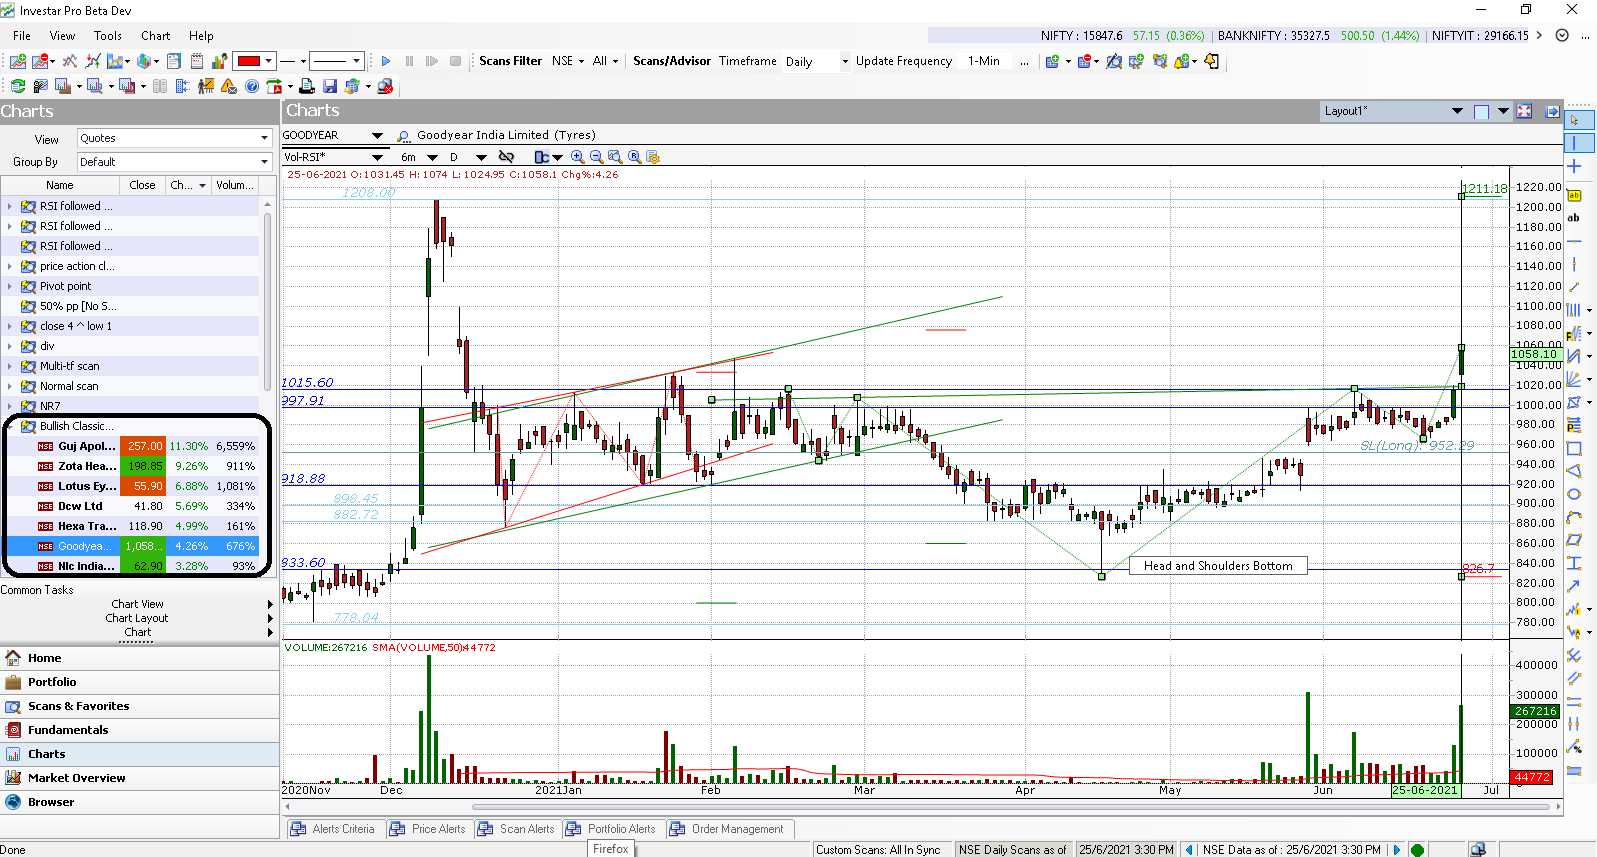
On visiting one of the stocks, e.g. Goodyear, we find that this stock broke out of a an “Inverse Head and Shoulders” pattern also called “Head and Shoulders Bottom”.
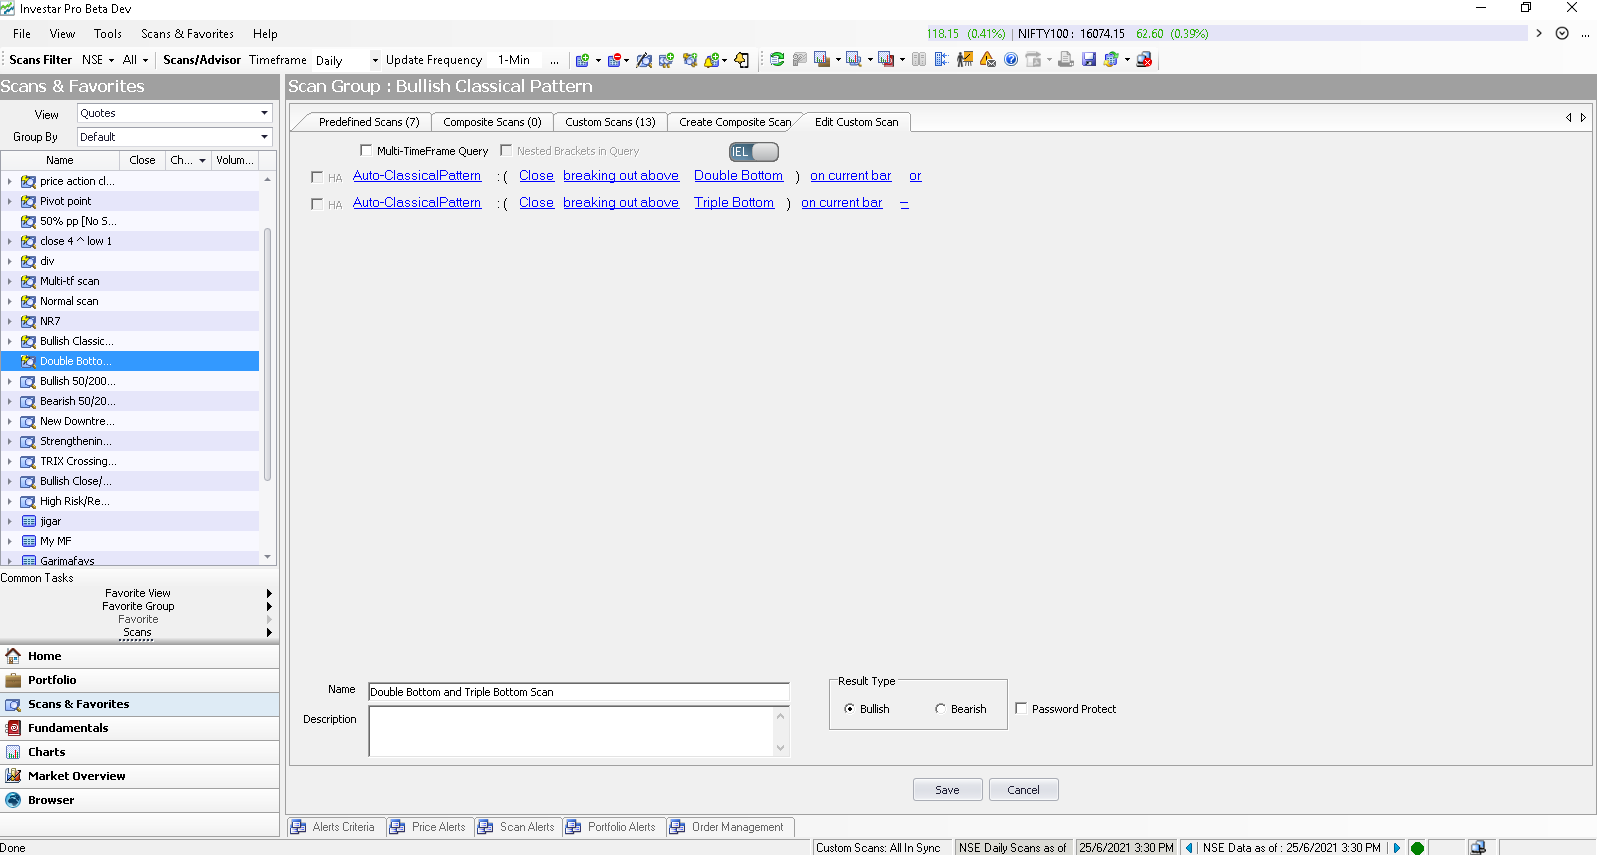
Likewise we can also look for any two patterns, e.g.Breaking out of “Double Bottom” or “Triple Bottom” with the following custom scan:
The green and red horizontal lines are the theoretical target and SL lines respectively, but at times you will need to have your own SL to provide you the best Risk/Reward Ratio. We will be enhancing the Target/SL feature in the future, so stay tuned!
Similarly, we can also scan for any of the Bearish Classical Patterns.
Which Classical Pattern scans are supported?
As experienced traders will know, a Classical Pattern is to be traded only once it is completely formed. We support the scanning for the following classical patterns, the patterns with links have a related blog post explaining how to trade it:
- Flag and Pennant Chart Patterns
- Rising and Falling Wedge Patterns
- Head and Shoulders Pattern
- Double Top and Double Bottom Patterns
- Ascending and Descending Triangle Chart Patterns
- Cup-with-Handle
- Rectangle and Price Channel
- Rounding Top/Bottom
To understand the Classical Pattern feature, you can also see our video for the same here (although some features have changed (as mentioned below):
What other changes are there in this Investar Beta?
A stock will show up in a Classical Pattern scan as soon as a Bullish Pattern is broken out on the upside and likewise a Bearish Pattern on the downside. At times, however, you want to see the Classical Patterns that are being formed even before they are completed. For this reason, we have given options in this Beta release to color these “Partial Classical Patterns” with a different color, so you can clearly distinguish a complete pattern in the chart from a partial one.
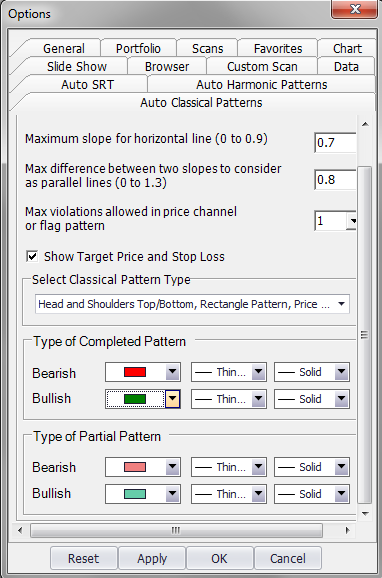
Also, another change in this release is that now the Target and Stop Loss lines will show for Partial Patterns also to enable traders to anticipate the potential target and stop loss even before the breakout happens and the pattern is completed (based on feedback received from our customers). Do let us know what you think about the changes.
For more details, check out our video on “Auto-Classical Pattern Scans” for an in-depth look into this topic :
Great to see this update. I am using this s/w for last 6 months and find that its must have for any trader!
I can use this software in mobile phone?
You can use our mobile app in your phone. download using this link: http://bit.ly/2RKZGrT
I want to learn