Ascending and Descending Triangle Chart Patterns are an important tool in any Technical Analyst’s arsenal. They are generally continuation patterns that happen during a prior existing trend.
Ascending Triangle Pattern
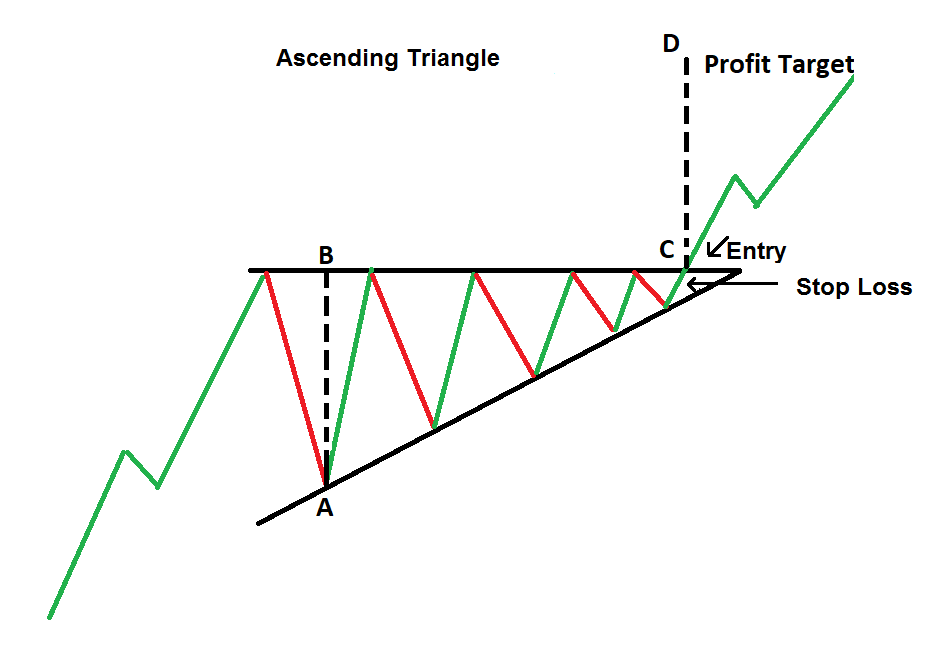
An Ascending Triangle is a Classical Chart pattern that is used in Technical Analysis to indicate a continuation of a trend. It is created by a horizontal resistance line that is drawn along the swing highs, and a rising up trendline that is drawn along the swing lows as shown in the image below:
The breakout in an ascending triangle can occur to the upside or downside. Ascending triangles are often called continuation patterns since the price will typically breakout in the same direction as the trend that was in place just prior to the triangle forming.
An ascending triangle gives a clear entry point, profit target and stop-loss.
A trader enters the trade on the long side, if the horizontal line is broken out on the upside. The stop-loss in this case would be the lower trendline. The target would be the widest part of the triangle.
If a breakout happens on the downside of the ascending trendline, a short entry can be taken and a stop-loss can be put above the horizontal line. Again the target would be the widest part of the ascending triangle.
Like any support/resistance or trendline breakout/breakdown, volume plays a very important part in confirming the strength of an ascending triangle breakout/breakdown. The volume should be low and below average as the ascending triangle is nearing completion and when the breakout or breakdown happens, the volume should be high, indicating that big money is participating in the move.
An ascending triangle can be high reward to risk trade as the stop-loss is small (because of the narrow width of the triangle at the time of completion), but it is also prone to false breakouts, hence one can minimize the chances of a false breakout by following rules similar to the ones applicable on trendline and support/resistance breakouts:
- Ensure that the number of touches on the trendline or resistance are high (minimum two touches are required)
- Ensure that the volume going into the pattern is low and the volume on the breakout is high.
Descending Triangle Pattern
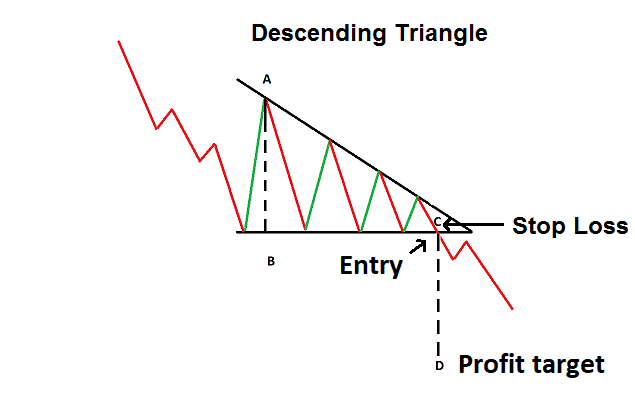
A descending Triangle Pattern is the exact opposite of the ascending triangle pattern. It is a bearish continuation pattern indicating that the prior downtrend will continue. It is created by a horizontal support line that is drawn along the swing lows, and a falling down trendline that is drawn along the swing highs as shown in the image below:
A trader usually enters the trade on the short side, if the horizontal support line is broken down on the downside. The stop-loss in this case would be the upper down trendline. The target would be the widest part of the triangle.
If a breakout happens on the upside of the descending trendline, a long entry can be taken and a stop-loss can be put below the horizontal support line. Again the target would be the widest part of the ascending triangle.
Ascending and Descending Triangle Patterns – A comparison
An ascending triangle generally happens in an uptrend and is a bullish pattern usually traded on the upside while a descending triangle generally happens in a downtrend and is a bearish pattern usually traded on the downside. Both patterns can however be used as reversal patterns, however the use of that is rare.
Ascending and Descending Triangle Patterns in Investar Software
Although ascending triangles are not directly displayed in Investar software, you can indirectly get them by enabling the Auto-Support/Resistance and Auto-Trendline features. Strong patterns would be formed when the resistance/support line is dark blue and the trendline is blue in color. One can also look for volume to be below the average 50-bar SMA of volume before the pattern forms and then atleast 2x the 50-bar SMA of volume after it is formed.
For more details, check out our video on “Auto-Classical Patterns” for an in-depth look into this topic :

