In this blog post, we will learn about one indicator that has correctly predicted the start of the long term Bull Market from May 2020. It just gave a sell signal in the NASDAQ in the week ending 21st Jan, 2022. Will it do that for Nifty too and help predict a market crash? Find out in this blog post!
But before we get into the details of this simple indicator, let’s understand why it is important and necessary to know when a long-term Bull market starts and when it ends. This is because even during a long-term bull market, there are many short-term corrections. E.g. for the long-term bull market that started in mid-2020, there were many short-term corrections (see shaded areas in the chart below), and those who liquidated their long-term holdings during that time, missed out on the capital appreciation provided by a long-term bull market. Hence, knowing this can help long-term investors stay invested in stocks during a long-term uptrend.
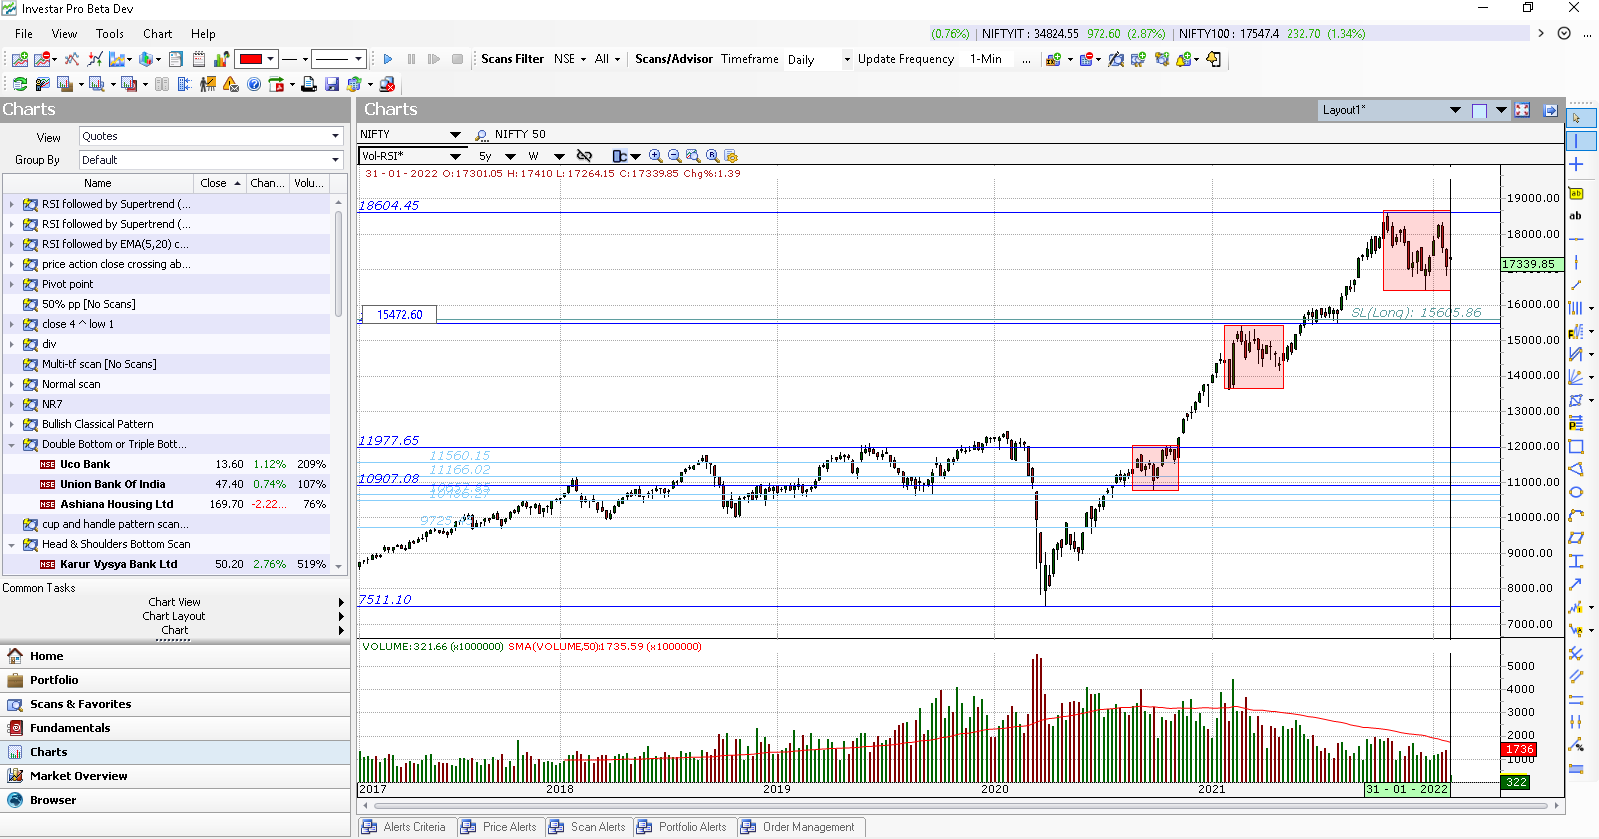
Why is it important to know when a Bull Market ends and a possible Bear Market starts? That’s because during a Bear Market even the best blue chip stocks can go through a correction of 30-50% and many other stocks, even more. Hence, knowing this can help Long-Term investors to possibly exit some holdings and raise cash for the next bull market.
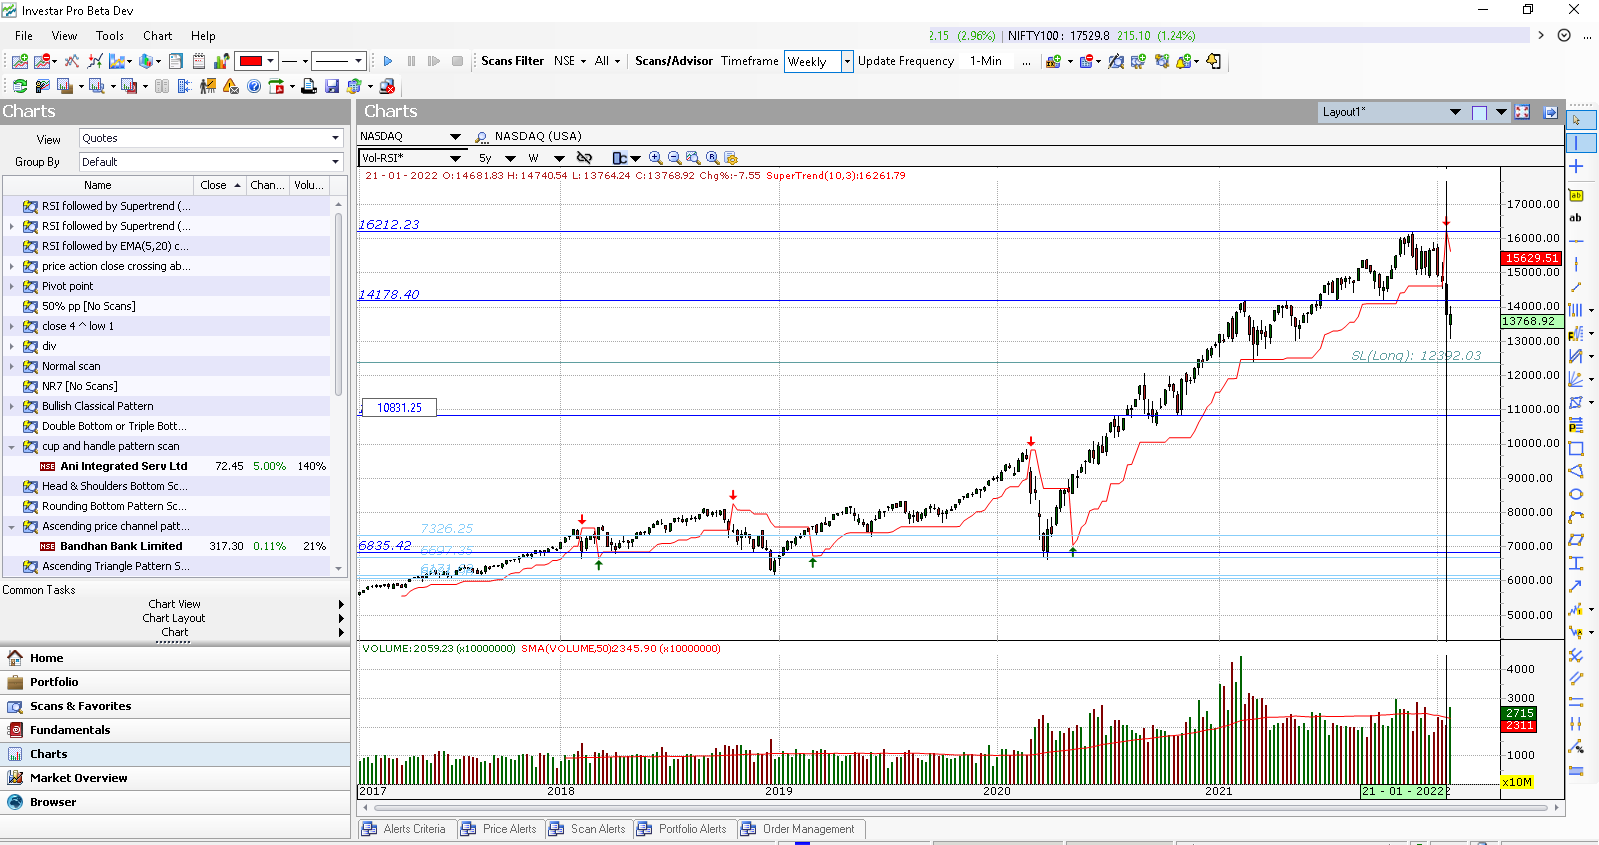
So what is this indicator that can help us know when a Long-Term Bull Market has ended? It’s none other than the SuperTrend Indicator. As you can see in the following NASDAQ weekly chart, NASDAQ gave a Supertrend buy signal on 4 May, 2020, and hence started its long-term uptrend, which turned out to be the start of the Bull Market. Supertrend gave a sell signal in the week ending 21st Jan, 2022 on NASDAQ, hence indicating a possible end of the Bull market.
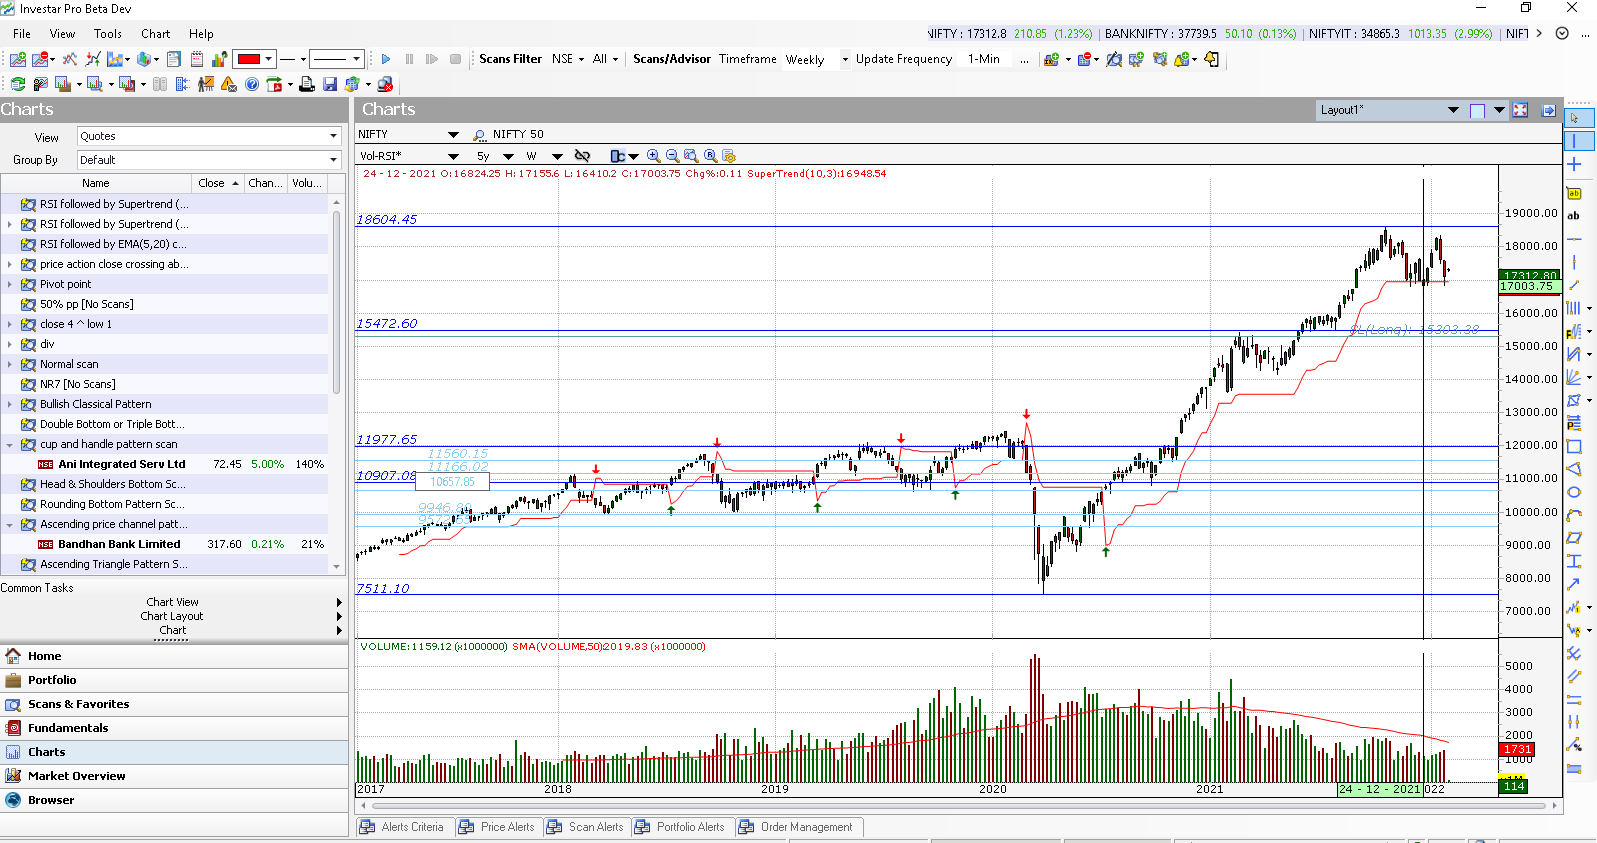
Likewise, we can see in the NIFTY weekly chart above that a long-term uptrend (and hence a Bull Market) started on 6th July, 2020 after the Covid correction. During an uptrend, the Supertrend(10,3) value acts as a strong support and we can see in the above NIFTY weekly chart that NIFTY has tested this level (16948) atleast 7 times since Dec, 2021. Hence, we can say that a break below 16948 on a weekly chart will give a strong sell signal, with a good chance that the long-term uptrend has ended. However, one needs to make sure that weekly candle formation is complete before making this decision. E.g. in the week ending 24th December, the NIFTY went below this level intra-week but then was able to recover and close above this level and hence did not give us a confirmation of the end of the long-term uptrend.
As with other indicators, Supertrend can also give a false sell signal, especially if the trend is not that strong and is more of a sideways trend, but the current trend is so strong, that even if a Sell signal does not predict the next Bear Market, it will surely mark the end of the current Bull Market.
So, do you think the Nifty will break the Supertend support and start a long-term correction? Do let us know your opinion in the comments below!
For more details, check out our video on “How to know when Bull Market has ended?”
This post is very informative and the images are very helpful. It’s great to have a resource like this to quickly understand the concept. The author did an amazing job of breaking down the concept in an easy to understand manner. Today, India is one of the world’s leading economies, and its trade and commerce sector is growing rapidly. It is the world’s largest exporter of IT services, textiles, jewelry, and drugs. Now I like to introduce Definepedia is an online encyclopedia and dictionary platform that provides reliable and accurate information and definitions on various topics.
Glad you found it useful! hanks for leaving feedback.