Buying options is a risky game and it is said that more than 90% of option buyers lose money. This is because, most traders do not do proper risk management when placing option trades. Risk Management is absolutely essential because the movement in Nifty/BankNifty is very fast and a good gain can turn into a loss in no time. Hence it is extremely important to have a proper Nifty Option Buying Strategy before getting into the market.
In this blog post, we are going to look at a Nifty Option Buying Strategy with well-defined risk management. With proper risk-management, both NIFTY and BANKNIFTY are great for trading intraday trends. You can trade both uptrends and downtrends.
In this Nifty Option Buying Strategy, we will look at ways to detect a change in trend in a timely manner and ride it with proper entry and exit points. In order to detect a change in trend, we will use:
- Auto-Trendline Breakouts/Breakdowns
- Auto-Support/Resistance breakouts/breakdowns
- Supply/Demand Zone Breakouts/Breakdowns
Nifty Option Buying Strategy in Detail
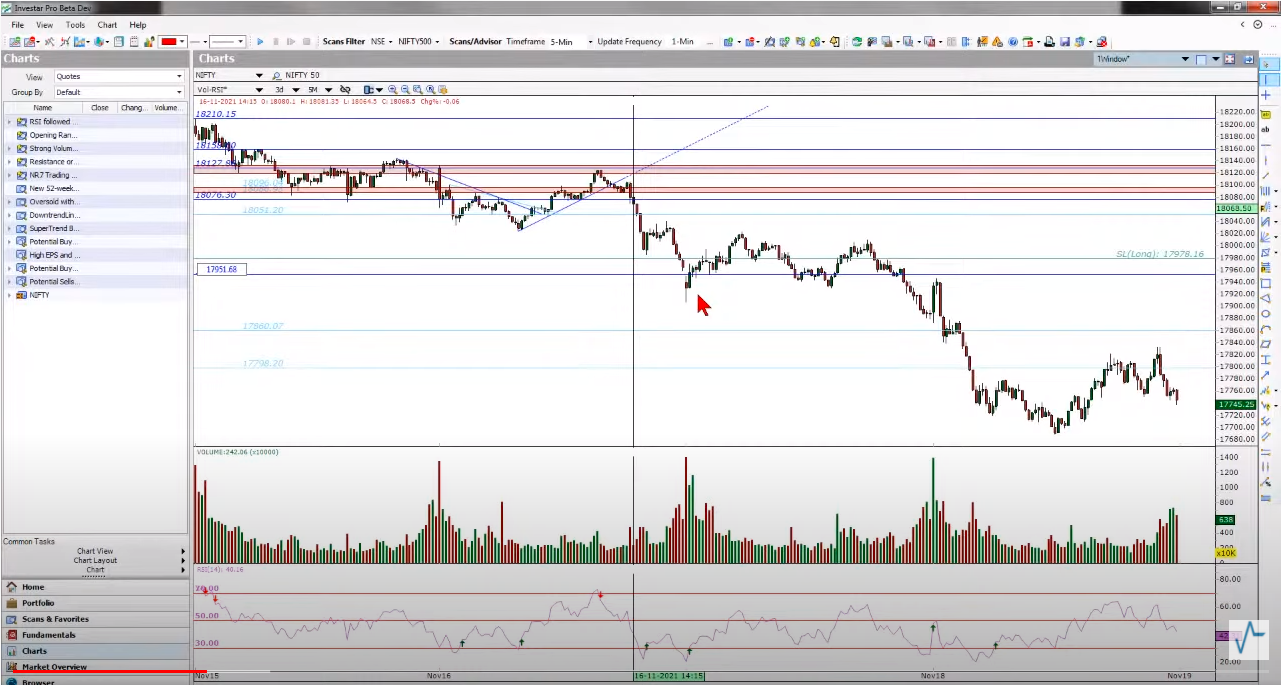
We will need to use a visual backtesting feature in Investar which shows the Support/Resistance/Trendlines etc based on where we put the cursor as if we were seeing the support/resistance/trendlines on that date. This can be done as shown in the screenshot below.

For this Nifty Option Buying Strategy, we will be using the Nifty 5-min chart for our decision-making, as a timeframe lower than this can give whipsaws. If we move the cursor to some date on the chart, say 16-11-2021 14:15 pm, we can see that there was a support breakdown at this time. Let’s try to see how to use this as an entry signal.
First, we need to decide which option we need to trade, CALL or PUT and which strike price.
Which Nifty Option to Buy
- For a Buy signal, buy nearest ATM strike price CALL
- For a Sell signal, buy nearest ATM strike price PUT. g.
- Suppose we get the Sell signal when NIFTY spot/future is at 18079, we buy either the 18100 PUT or 18050 PUT
- This is because the Option points are roughly equal to ½ the points in NIFTY futures for ATM CALLs and PUTs
- Hence we can define the risk and target properly based on FUTURES chart
- For Option Buying, we trade only the monthly expiry option, since the premium decays fast on weekly expiry options, and can work against an option buyer (if you are Option Selling, ideally you only trade the weekly expiry).
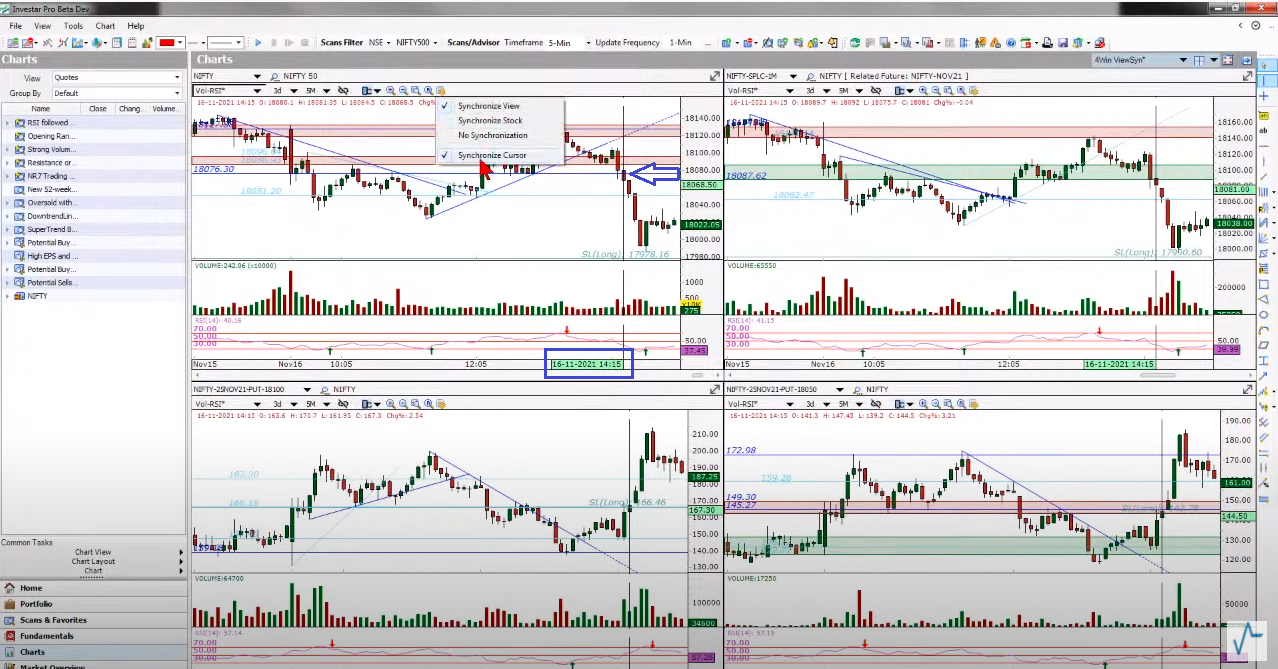
We can go to a 4-chart layout with Synchronize Cursor (as shown in screenshot below) where we have both NIFTY and NIFTY-SPLC-1m charts as well as a couple of ATM (at-the-money) PUT charts. When the support broke down at 18069 at 14:15 on 16-11-2021, we already had a confirmation due to the prior downtrend line breakdown followed by support zone breakdown.
In order to define the Reward/Risk of our Nifty Option Buying Strategy, can use the Vertical Line tool on the NIFTY spot chart (top left in the screenshot below), to get the approximate Reward (our short price target is the next dark blue Very Strong Resistance Line of 17951) and that turns out to be 125 points. We can similarly define our risk as the Stop/Loss which is basically the total points between the current price (our entry point) and the 2nd red resistance zone high, and that seems to be 55 points. You can use either the NIFTY or NIFTY future chart depending on your preference.
Now our Reward/Risk (RR) on the NIFTY spot chart will be 125/55 = 2.27. Which is pretty decent in spite of having a higher risk.
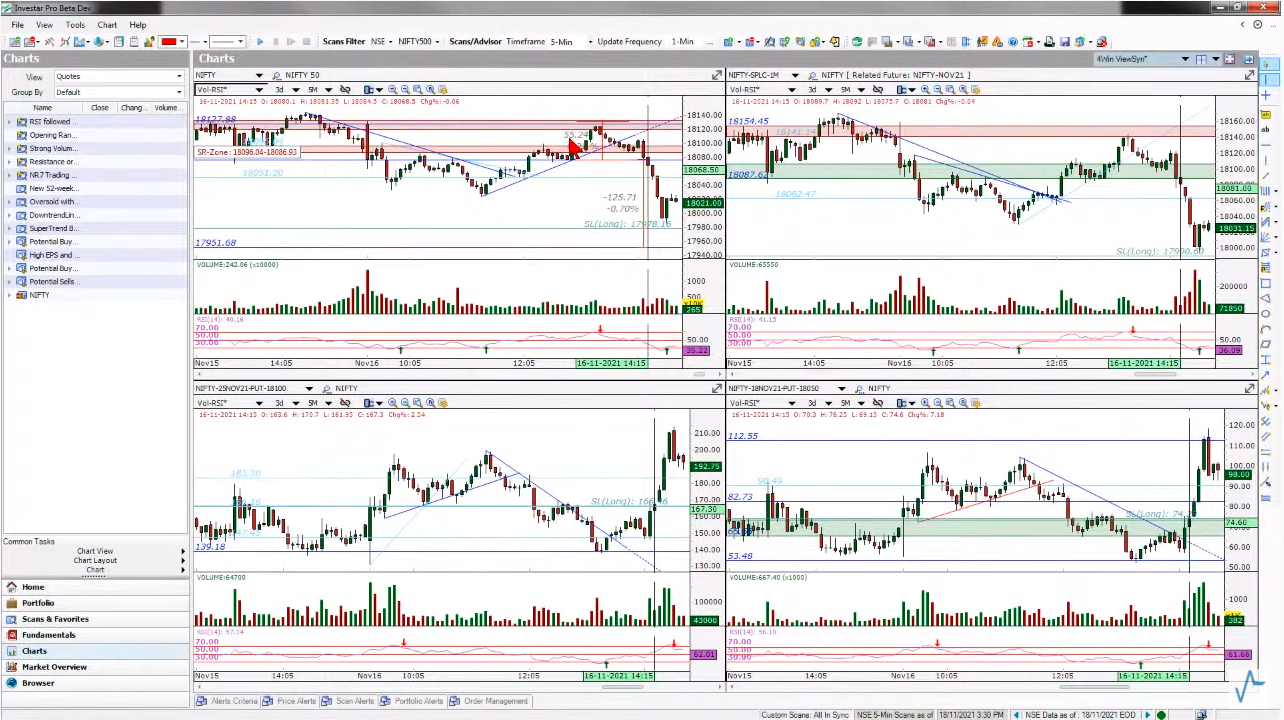
Also, as you can clearly see in the PUT charts, when the support is breaking down in NIFTY, both the PUT options start to go up on volume and hence confirming our entry in either of the PUTs. We can also decide between which PUT to buy based on the overhead resistance (as can be seen in the 18050 PUT, there is overhead supply zone and resistance while it is not there in 18100 PUT).
To deduce the RR on the NIFTY option, we simply divide the values for NIFTY we calculated above to get our NIFTY 18100 PUT Option target (Reward) as 125/2 = 62 points and Stop Loss (Risk) as 55/2 = 27 points. Hence, we can place a trade on the NIFTY-18100-PUT with a very clearly defined Reward to Risk ratio that is favorable to us.
If you want to learn about this NIFTY Option Buying Strategy in detail, please see this webinar.
I want to learn about shares futures and options but not for intraday.