We are pleased to announce Investar 6.2 with many exciting features:
- Enhanced Harmonic Patterns.
- Synchronize Cursor across different charts.
- Intraday History of upto 6 months
- Improved Zerodha Trading with support for trading Straddles/Strangles.
- Support for Expired F&O Symbols in Chart (Pro Edition users only).
- Show divergences within 2 bars also.
- Support for all types of Equity/Hybrid Mutual Funds .
- And many more…
Enhanced Harmonic Patterns
Harmonic Patterns was added as a new feature in Investar 6.1 and with 6.2 version, it is now totally enhanced with unique features not found in any other software, like PR Zones (for potential targets and stop losses), Partial Harmonic Patterns (to detect potential Harmonic Patterns before they form ).
What are PR Zones?
PR Zones or Potential Reversal Zones as they are called, are areas created due to confluence of Fibonacci retracement levels of a Harmonic Pattern’s legs (e.g. XA, BC, AB=CD), where the chances of reversals are high. Hence, they can be used as a target or stop-loss.
PR Zones in Investar can be:
- At the D Point (which is specified in terms of % value of D price) or
- A confluence of Fibonacci retracements which indicate targets.
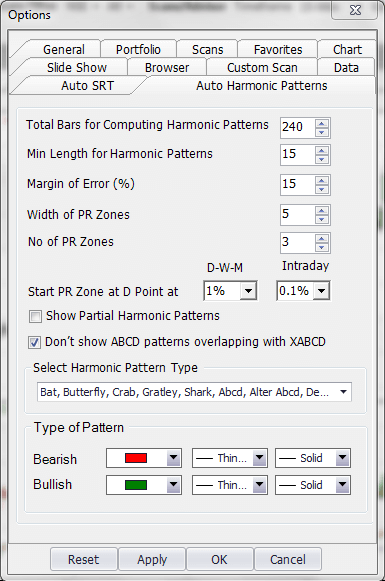
To specify the above, go to Tools-Options-Auto-Harmonic Patterns tab, and the following options can be set:
- Width of PR Zones – this specifies the width of PR Zones in increments of 5.
- No of PR Zones – Total no of PR Zones including the one at D
- Show PR Zone at D Point at – This value indicates the % tolerance around the D point at which a PR Zone is drawn.
How to use PR Zones in your trading?
To understand how to use PR Zones, let’s look at an example chart of NIFTY as below. Here we can see that a bearish Butterfly Harmonic Pattern was formed on 20th Jan, 2020. The 3 red zones indicate the PR Zones where the potential reversal can happen and hence they can be used as a target.
When a bearish Harmonic Pattern is formed, the price will tend to reverse from the D point (If it goes above the D point PR Zone, it would invalidate the pattern, hence the stop loss would be at the top of the high of the D point PR Zone). Once the price reversed at the D point PR zone, the target was correctly given by the next red PR Zone as shown in the chart.
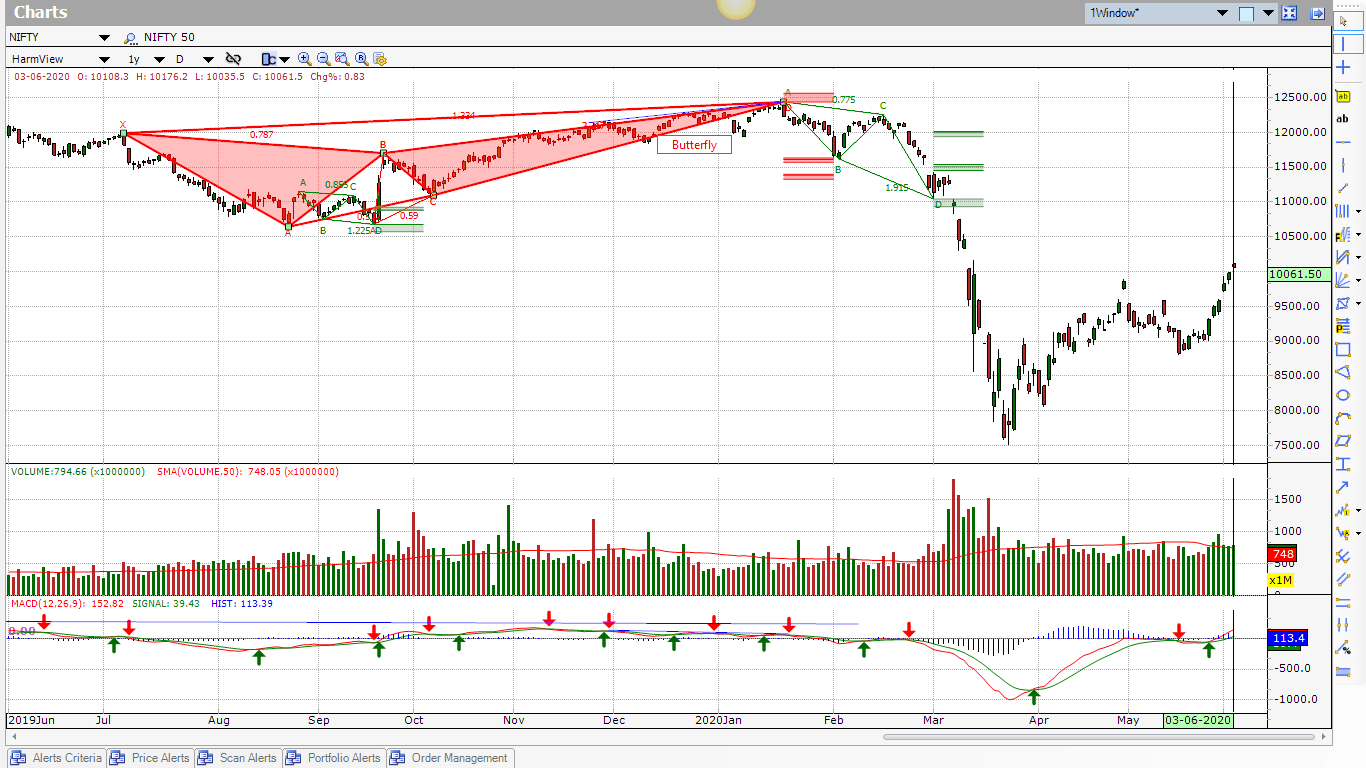
The green pattern that happened later on is an example where the D point reversal did not take place and our stop loss got hit.
Hence PR zones are a very useful tool for a Harmonic trader to decide what target and stop-loss to set.
Partial (or Incomplete) Harmonic Patterns
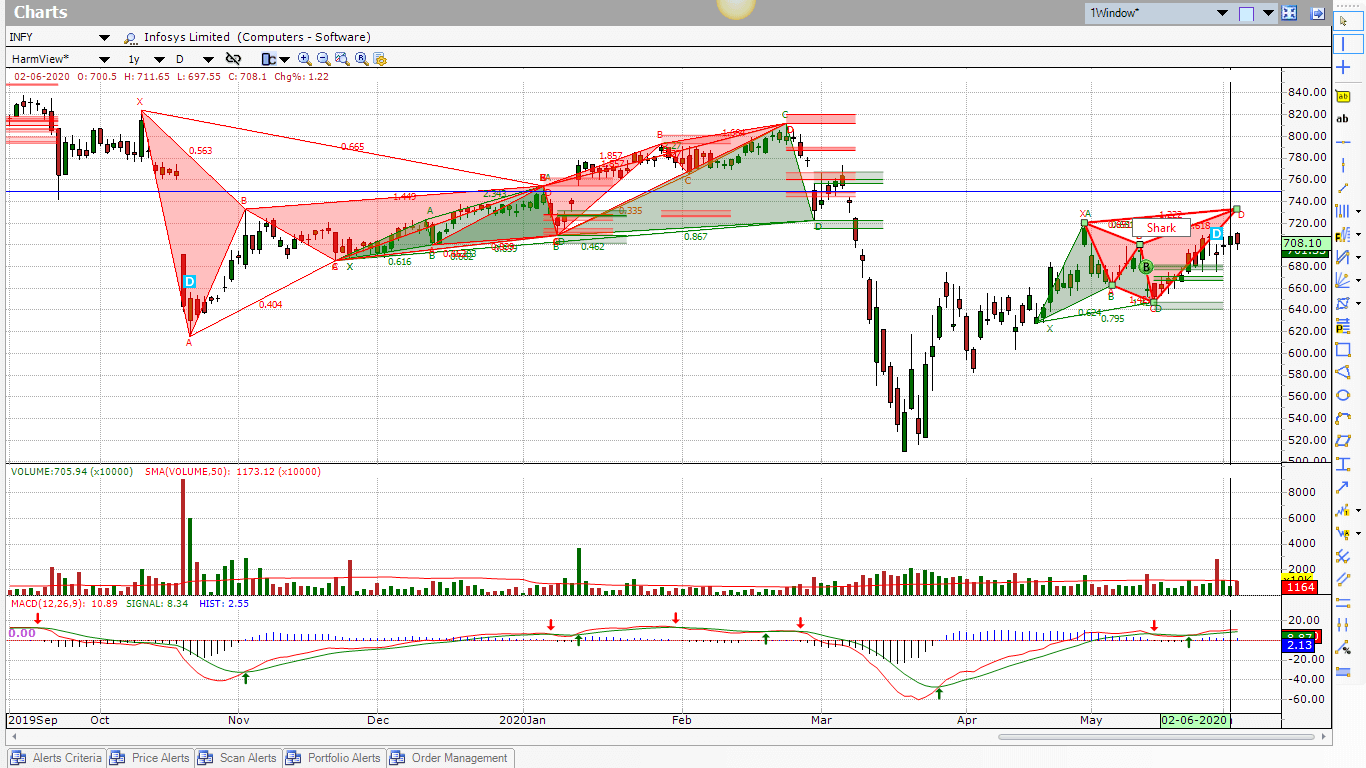
At times you want to be ready to take a Harmonic trade as soon as the D Point is complete. This new feature enables you to see at what point in the future the D Point is going to complete so that you can be prepared to take the trade accordingly. In the following INFY chart, you can see the D point on the Shark pattern near the current candle but not on it. This is indicating the potential value of the D point at which it will complete, in case a trader wants to be ready to take the trade as soon as it completes (i.e. you go short when the current price reaches the value indicated by the D point of the incomplete Harmonic Pattern).
New Harmonic Patterns
We have also added a few new Harmonic Patterns like:
- Alter Shark
- Max Bat
- Max Butterfly
- Max Gartley
- White Swan
- Black Swan
- Sea Pony
New Harmonic Scans
Apart from the new pattern scans, now you can create a scan for any Bullish (or Bearish) Harmonic Pattern as shown in the screenshot below:

Synchronize Cursor
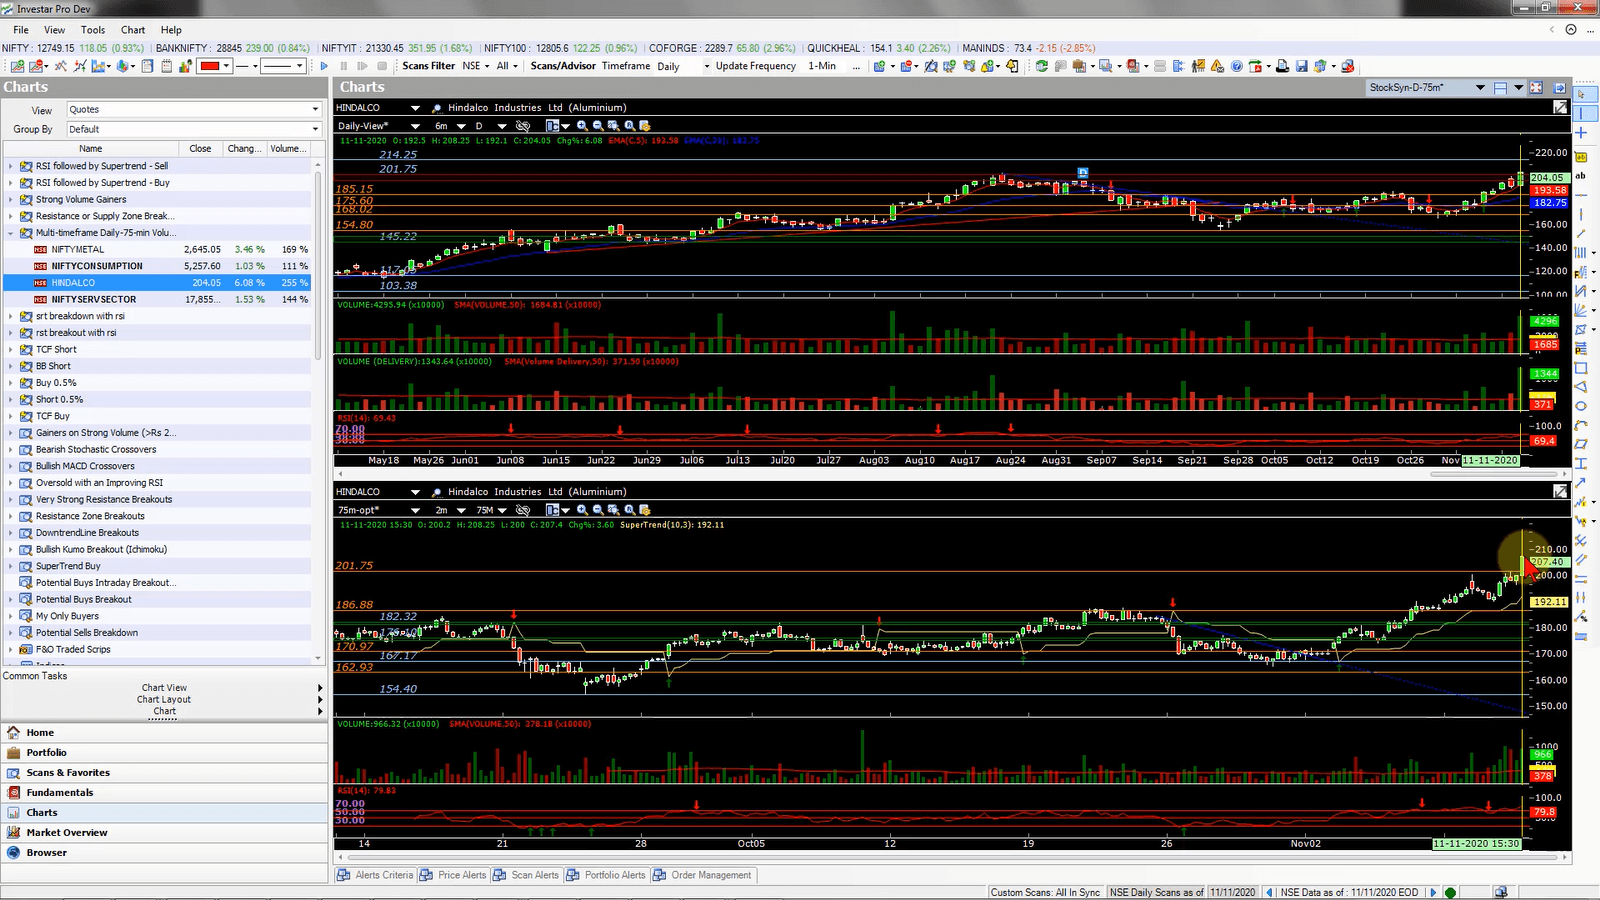
Now you can synchronize the cursor across different charts windows in a Chart Layout whether in Stock Sync or View Sync mode. To synchronize cursor across 2 windows, simply check the “Synchronize Cursor” menu as shown in the 2-window Nifty Daily-75m Layout below:
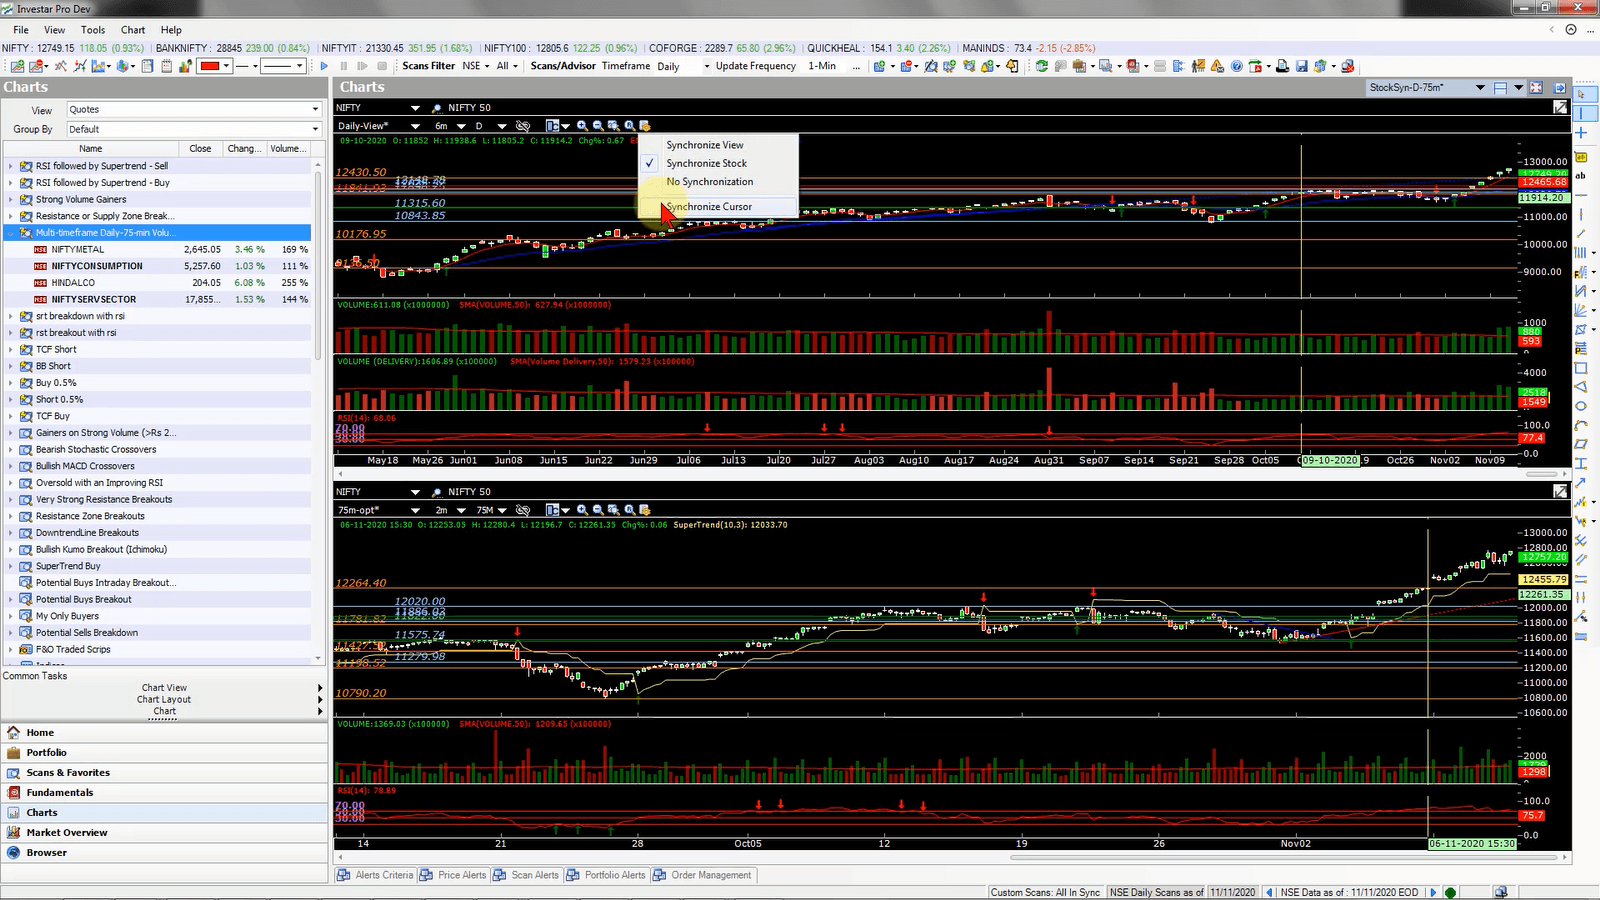
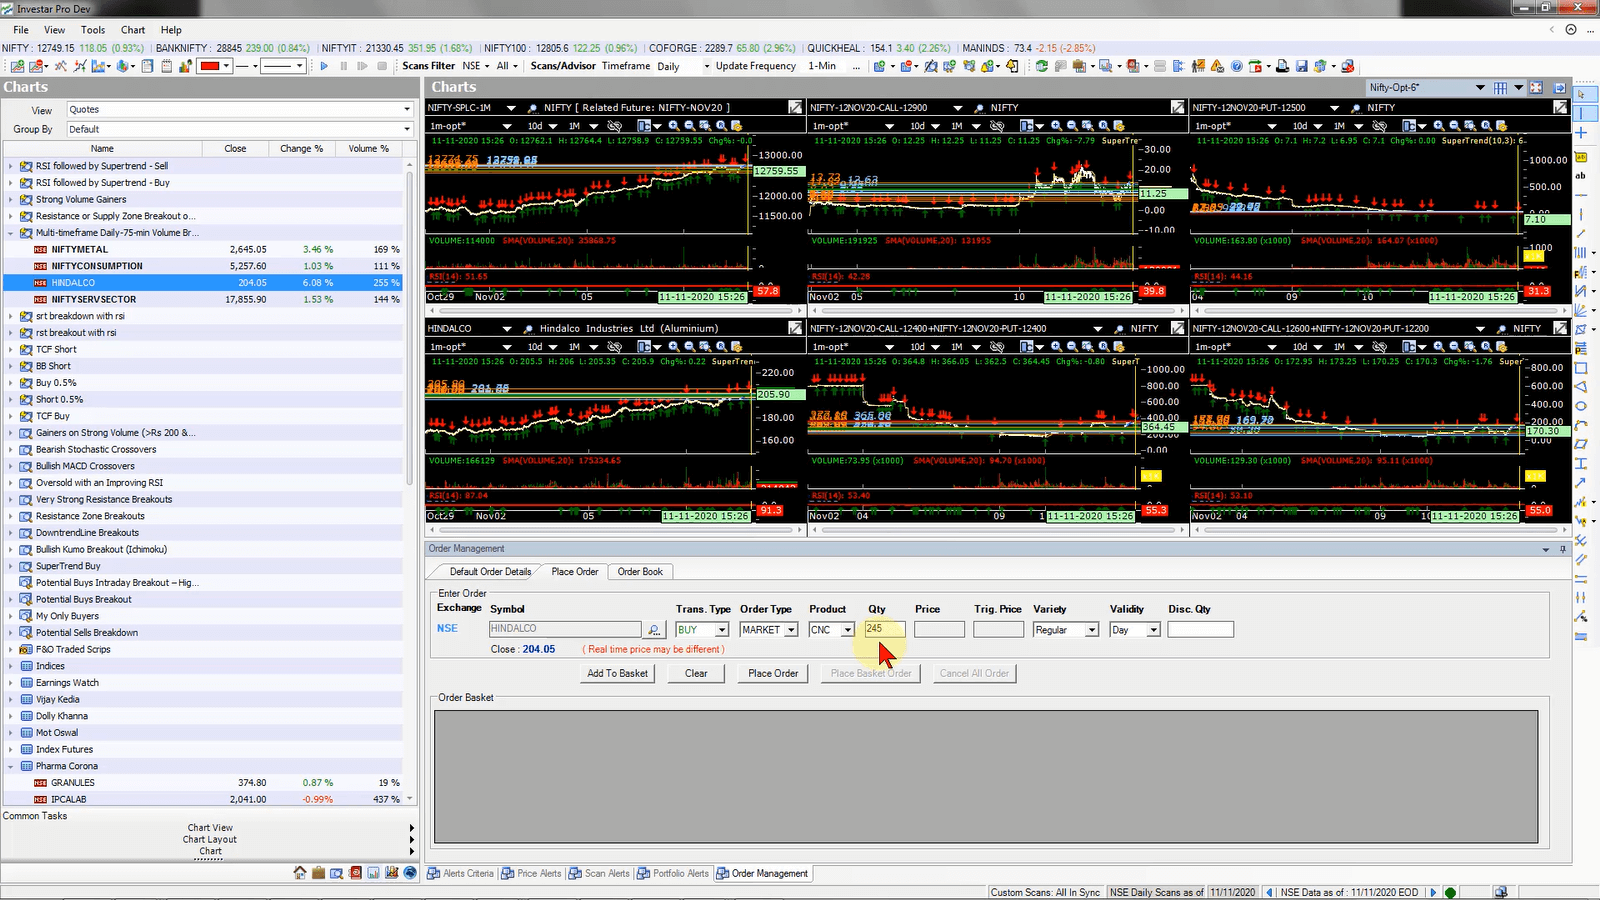
In Stock Sync mode, when you synchronize the cursor across different timeframes, it really helps in finding out multi-timeframe setups, like e.g. the multi-timeframe volume breakouts we usually post on social media. E.g. in the following screenshot, you can see that HINDALCO did a simultaneous breakout in Daily and 75-min timeframes, which gives a very high success setup as it is breaking out on volume in 2 timeframes. In such cases, if the cursor is synchronized, you simply click on a candle in one window (e.g. 75-min timeframe) and Investar will automatically position the cursor to the right candle in the other window (Daily timeframe)
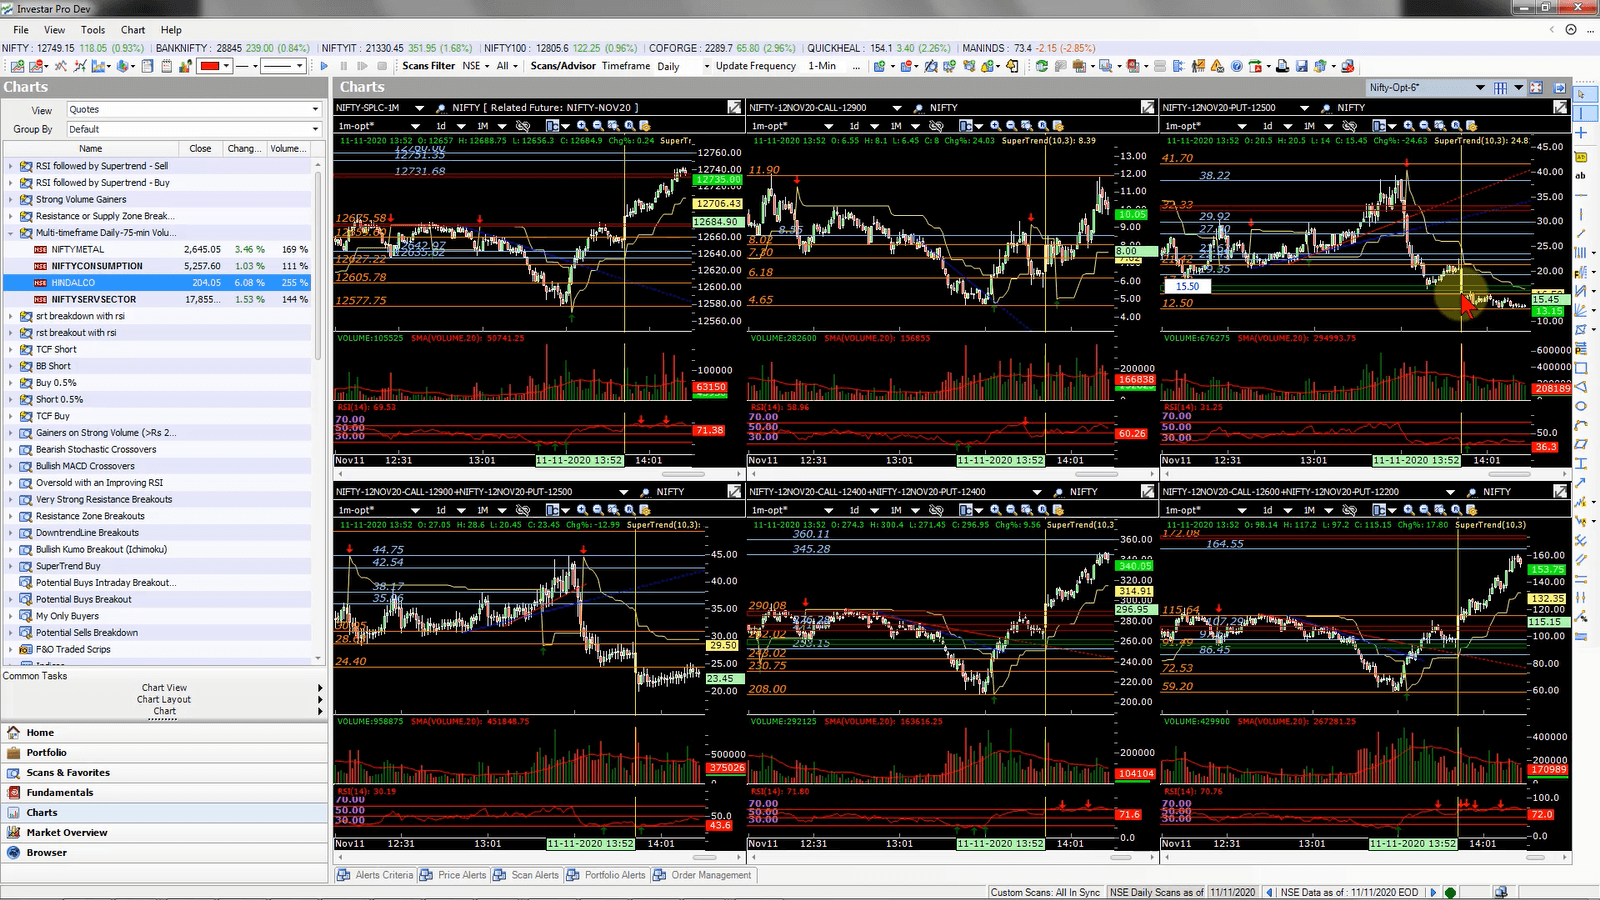
In View Sync mode, the Synchronize cursor can help to take faster trades by clicking on an underlying symbol like NIFTY and then when a signal occurs, you can quickly see whether you can take a trade in the corresponding Nifty Option. E.g. in the following screenshot, when Nifty made a new high, we can see that the NIFTY-12NOV20-PUT-12500 option suddenly broke the Auto-SR based support and that would be a perfect place to sell the option.
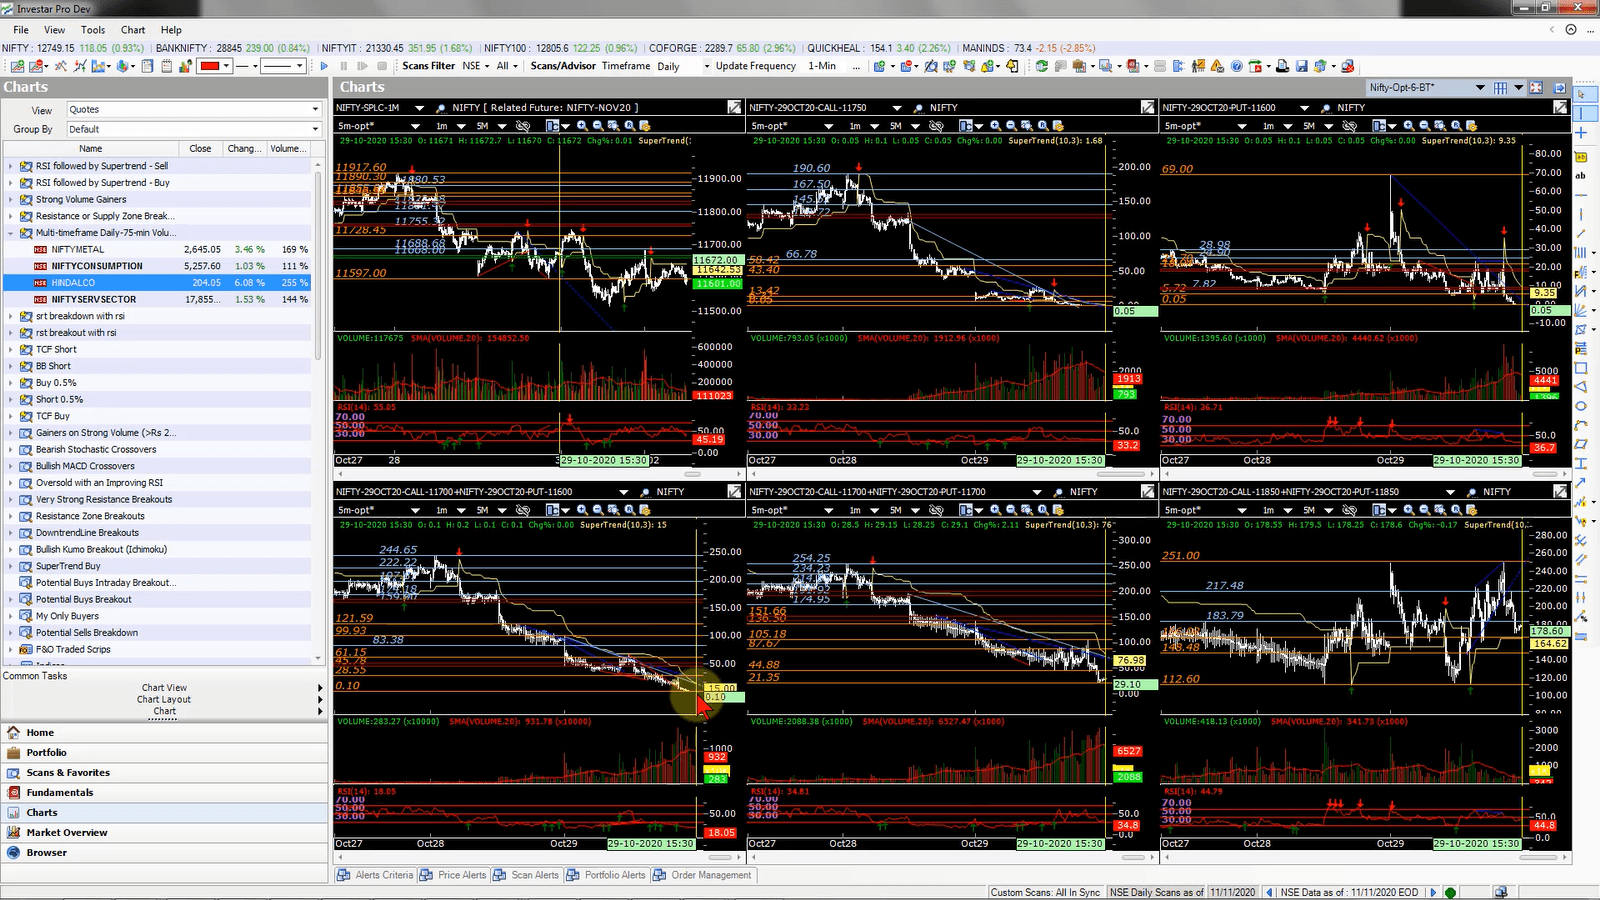
Expired Future & Option Charts (for Pro Edition users only)
We have now added Expired Future and Option chart support in Pro Edition. This can help to visually backtest an option strategy, e.g. in the bottom left chart of a Nifty 29-Oct20 11700-11600 Strangle, we can see that when Nifty stayed between the 11700-11600 range, the strangle theta decayed closed to near zero by the end of expiry day. This can allow an option traders to visually backtest different strategies that they are trading.
Improved Zerodha Trading with support for Straddles/Strangles
One of the very important risk management for any trader is the position size, and in many broker terminals including Zerodha, if you want to invest or trade a fixed amount, you have to manually calculate the shares or lots. Investar now has an Order Details tab, where you can specify the position size in terms of amount, and when you trade any symbol, it will calculate the no of shares or lots automatically as shown below.
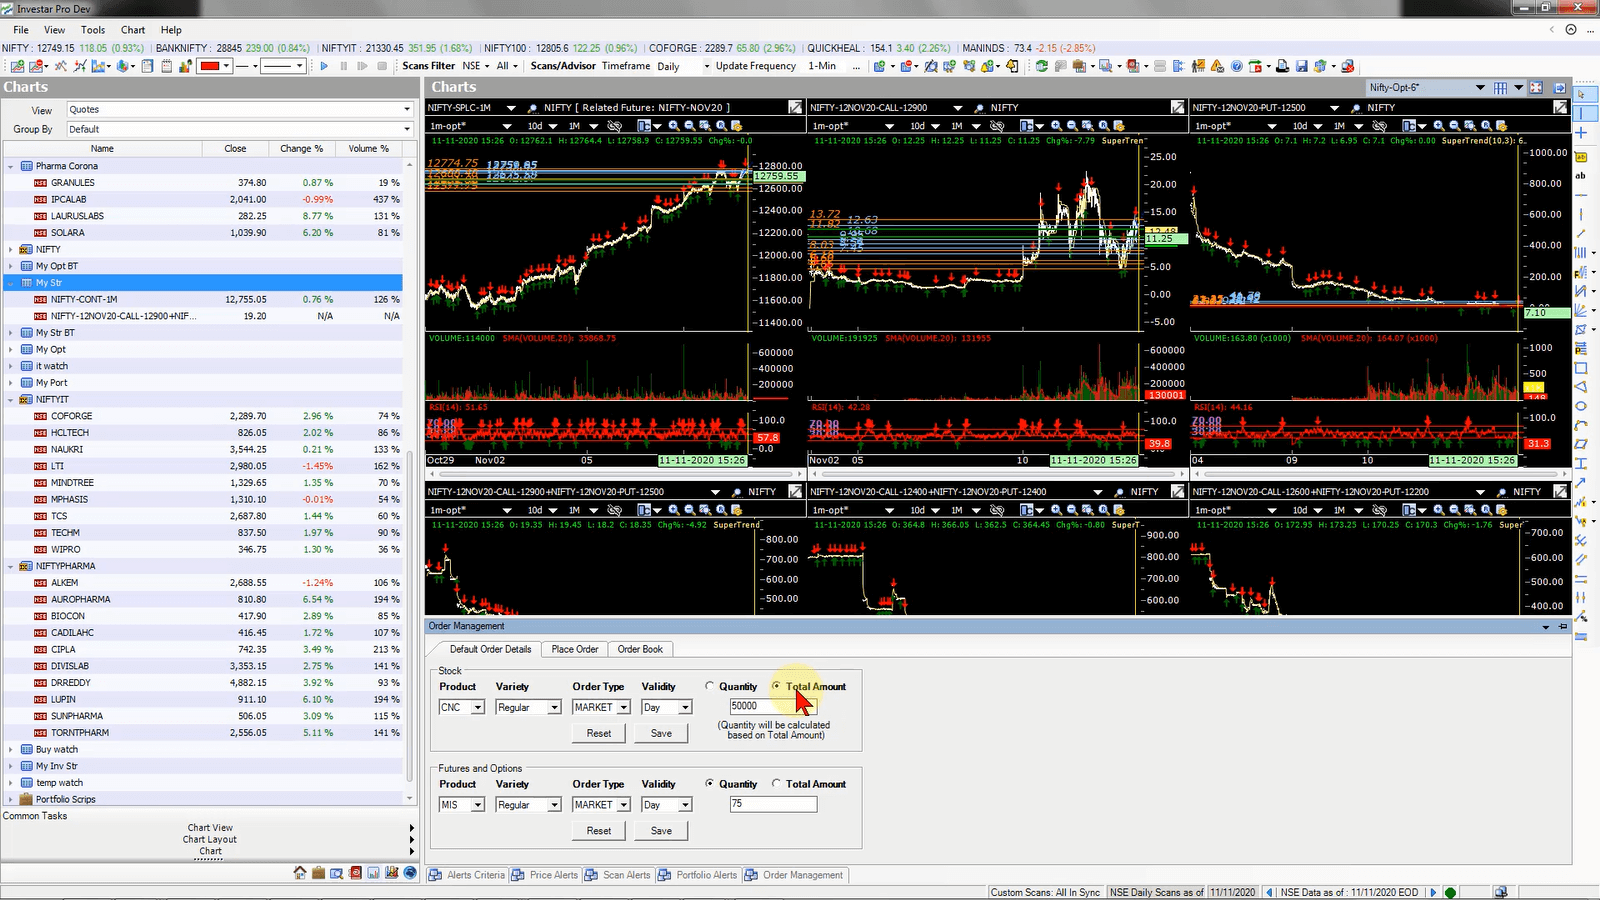
Now if we place a trade for any stock, it will automatically calculate the no of shares (rounded to the nearest integer), and in case of a Future or Option you can specify it in terms of your favourite lot size that you trade based on the risk you want to take. E.g. in the example below, where the amount was Rs 50000, Investar would automatically place the trade for Hindalco for 245 shares based on the current market price of 204.05 (245×204.05 = Rs 49992), thus keeping the position size for each trade or investment the same.
Support for all types of Equity/Hybrid Mutual Funds
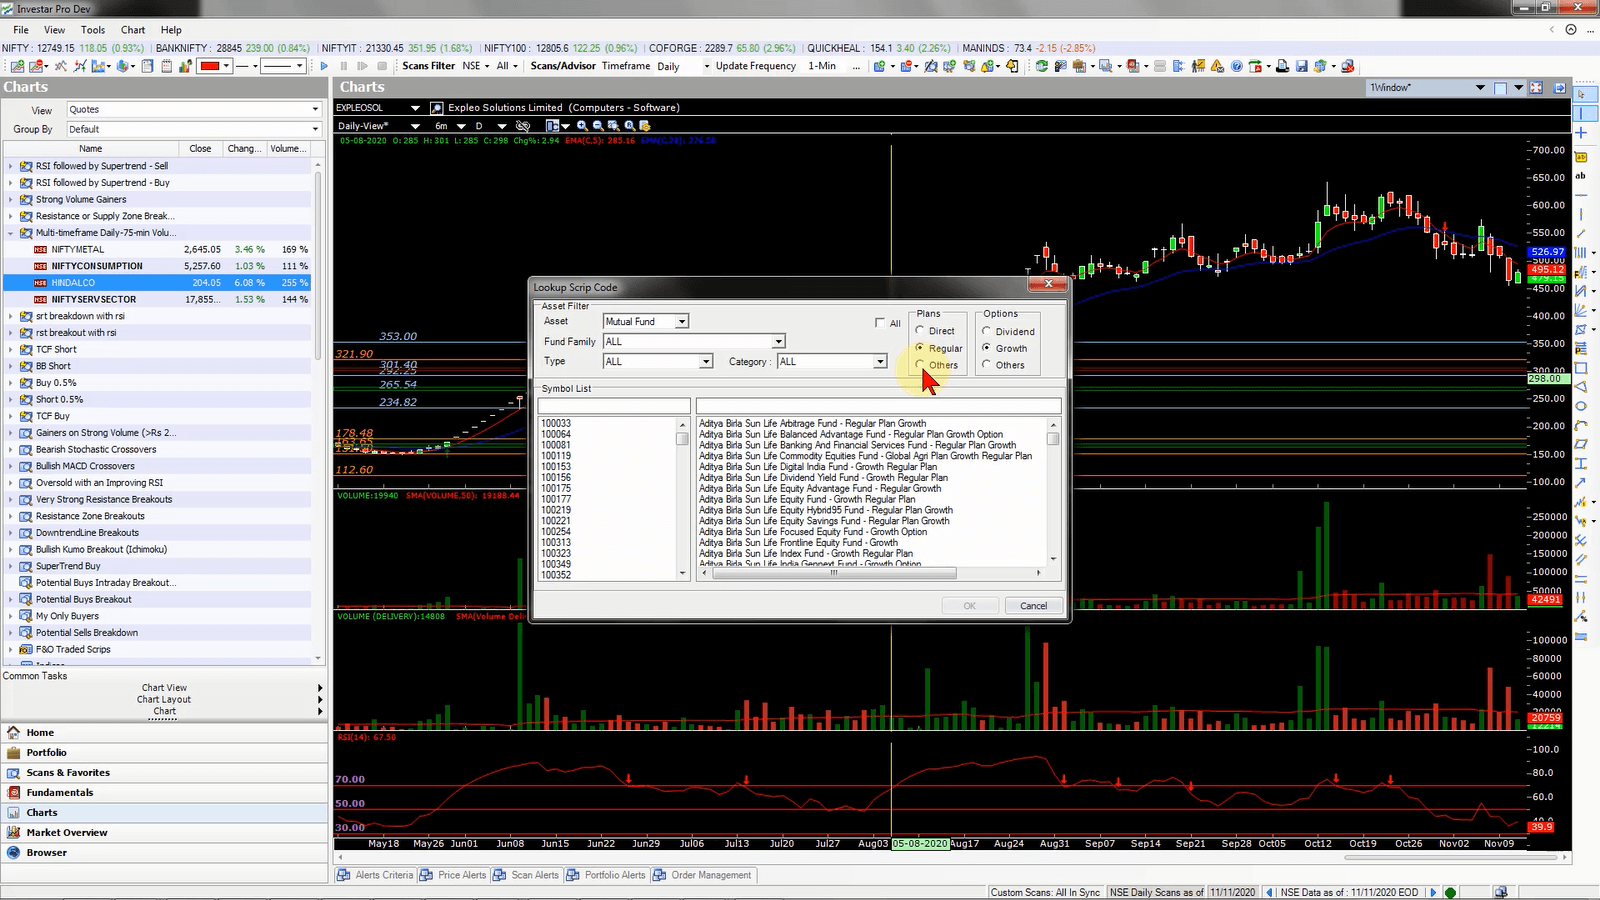
Investar now supports all kinds of Equity/Hybrid Mutual Funds with the Regular/Direct Plan and Dividend/Growth Option. Not only that but at times some funds do not fall in any of the above categories and for them, we have introduced the “Others” option as shown below.
Show Divergences within 2 bars
One of the suggestions we got from users of our Auto-Divergence feature was to be able to detect Divergences a lot earlier, and although we earlier showed Divergences only if they were showing clear divergences (i.e. for a low, you need both the previous and subsequent candle to be higher), however, it caused the Divergence to be detected late. Now, we have introduced an option in Auto-Divergence tab to “Show Strong Divergences” only which if enabled will behave like before, but if not enabled, then it will show Divergences as soon as a scrip makes a new high/low and then falls/rises on the next candle (even if it is not fully formed). Keep in mind though that if you keep this option unchecked, although you have the benefit of detecting Divergences early, some of the Divergence signals may become false by the end of the current candle.
If you’d like to see the above features in action, you can see the “What’s New in Investar 6.2” video in English.
I may be interested in more details