We are very excited to let you know that a new version of Investar Mobile for Android OS is now available! It has a totally re-vamped UI with Enhanced Charts and like before, it has support for Auto-Support/Resistance, Auto-Supply/Demand Zones, Auto-Trendlines and Auto-Divergence (available with the Auto-SRT Addon). So, how is the new version different and better than before? Read on to find out more…
Market Overview
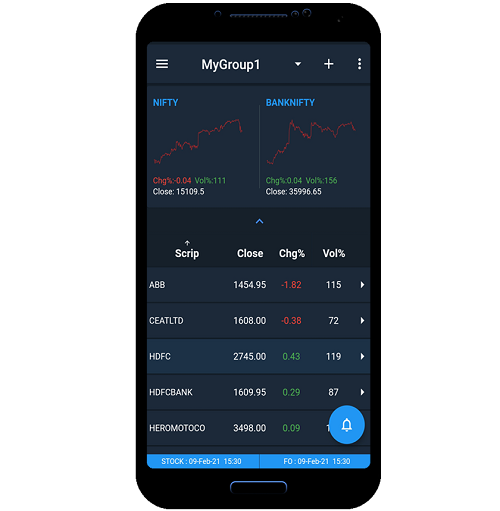
A quick market overview is now available by simply tapping the down arrow in the centre (as shown in the screenshot below). This gives the NIFTY and BANKNIFTY charts along with their current prices.
Scrip Detail View
When you select the ‘>’ at the right of a scrip in any watchlist, you will see a Scrip Detail view where you can see the important details about any stock and also the important Pivot Levels as show in the screenshot below: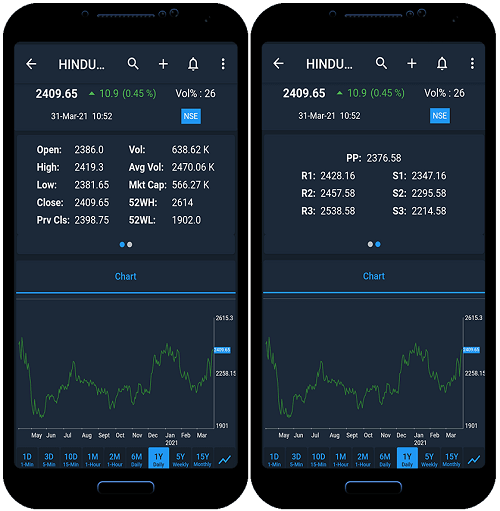
Enhanced Scrip Code Lookup
The scrip code lookup is a lot more enhanced, especially for Futures and Options, and can be done anywhere from the Scrip Detail screen or also within the chart itself where you find the “Search” icon. If you select that and select “Options”, you will be able to quickly lookup all the Options. E.g., if you type “NIFTY 14850”, you will see all the NIFTY Call and Put options with 14850 strike price, as shown in the screenshot below:

When you add an F&O scrip from the watchlist menu as shown below, you will see a more detailed list of all futures and options which can be filtered by call/put, expiry (nearest, near and far) and for options, whether they are “In the money”, “Out of the money”, “At the Money” or “Deep in the Money”, as shown in the screenshot below:

We can simply add one or more of the scrips after choosing these filters, and also remove from the list of scrips at any time, as shown below:

User-friendly discovery of new stock ideas
One of the USPs about the Investar Mobile app has always been how easy it makes it for traders and investors alike to discover new stock ideas. This version takes it one step further and makes it a breeze to add a stock to your watchlist. Now, you can easily swipe through stock charts of stocks appearing in a particular scan and add them to one or more watchlist(s).
We’ve added a yellow “star” button on the top right of the chart, which gives a visual indication about whether a stock is already included in any of the watchlists.
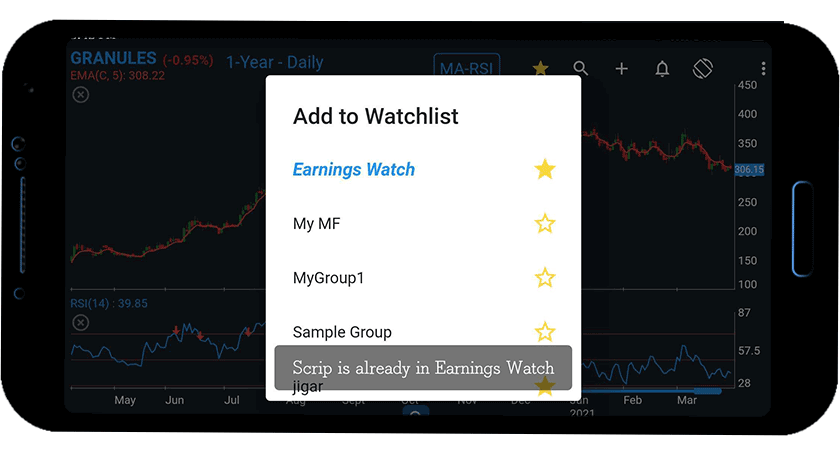
If you select this while navigating a scan, then the stock can be added to a watchlist of your choice. An empty “star” indicates that the stock is not in any of your watchlists. A half-filled yellow “star” indicates that it is in one or more of your watchlists and a fully solid yellow “star” while navigating a watchlist indicates that it is part of a watchlist. At times, you will want to lookup a stock and see its chart and then add it to a watchlist. While adding to a watchlist also, you can choose any watchlist to add the stock easily (A star beside the watchlist name indicates whether it is already included in the watchlist or not). E.g. in the screenshot below, indicates that “GRANULES” scrip is already part of “Earnings Watch” but not in any other watchlists:
Once you’ve added stocks to a watchlist, you can swipe through charts of that watchlist on a daily basis to monitor your watchlists.
Chart Views (or Chart Templates)
Chart Views make it very easy to store the indicator settings in a template so that you can quickly switch to a different template if you like. To access the Chart Template to edit a Chart View or create a new one, you can long-press anywhere on the Chart.
Greatly enhanced Indicator menus
With the new version, it becomes a lot easier to add an Indicator with the “Add Indicator” menu which can be accessed by long-pressing any part of the chart, as follows:

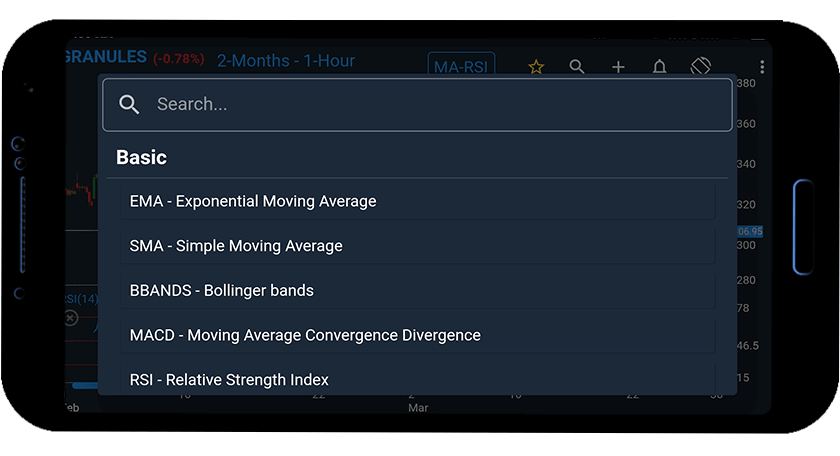
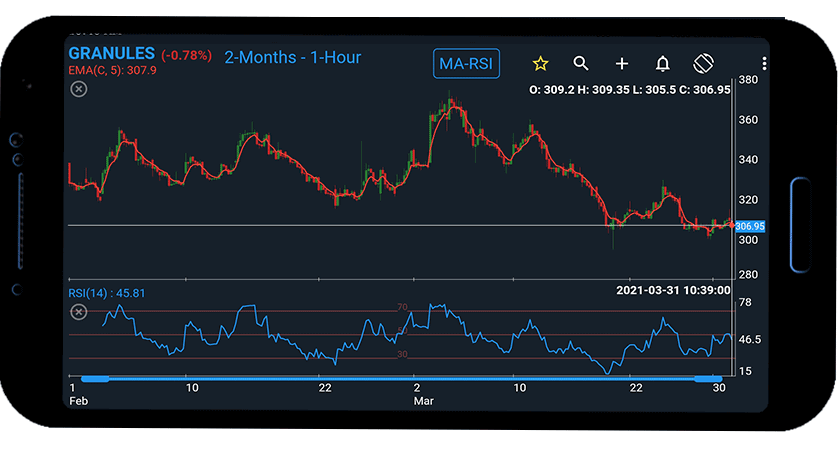
Once, you add an indicator say EMA, all the indicators for that Chart View can be added in the dialog without leaving it by keeping on selecting the ADD buttons, as shown in the screenshot below.
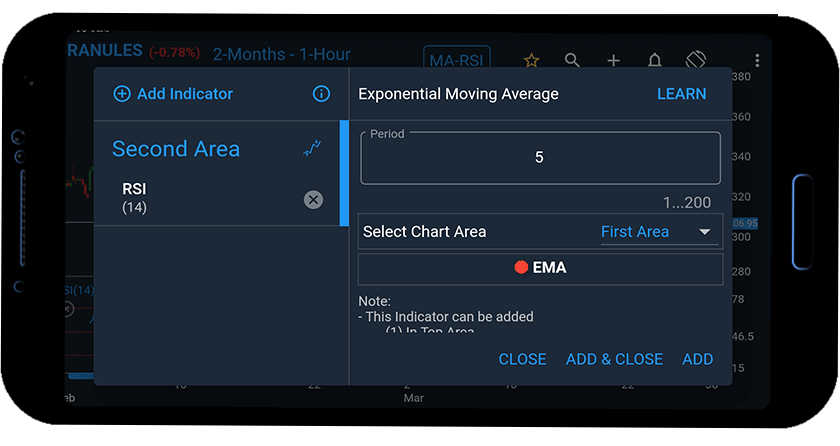
Once all the indicators are done adding, you can “ADD & CLOSE” for the final indicator to close the dialog and get all the indicators added at once. Earlier the same steps were very cumbersome and took a lot of back and forth between the chart and the indicator dialog.
Pl clarify, Am I using 5.0 version
Dr Anand
Whether sound scan alert is possible in mobile App
Thaks for your feedback. we will add this is future update.