In this blog post, we will look at the importance of Rising and Falling Wedge Patterns which are important reversal Classical Patterns.
Rising Wedge Pattern
The Rising Wedge is a Bearish Reversal Pattern that starts wide at the bottom but contracts as the prices move higher. The price usually fluctuates between an upper trendline and a lower trendline, where the upper trendline acts as a resistance and the lower trendline acts as a support. It is usually formed over a period of 3-6 months. The prior trend before formation of this pattern is an uptrend, and a sell signal is given when the lower support is broken towards the end of the pattern. An increase in volume on the support break can also give a confirmation about the sell signal.
An example of a Rising Wedge Pattern is shown in the screenshot below.
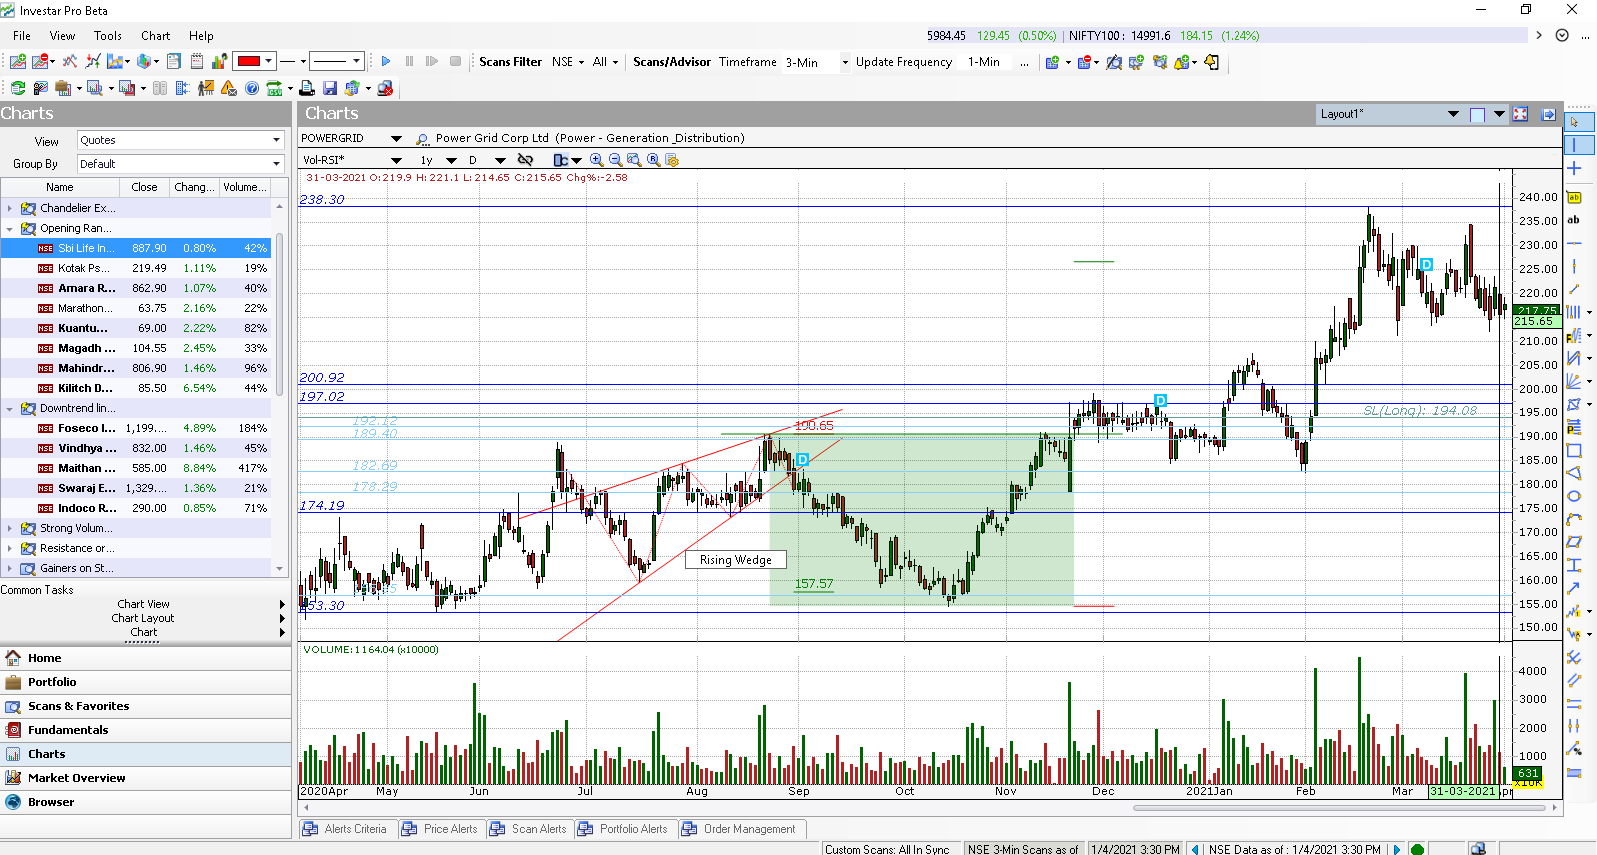
While it is a consolidation formation, the loss of upside momentum on each successive high gives the pattern its bearish bias. However, the series of higher highs and higher lows keeps the trend inherently bullish. The final break of support indicates that the forces of supply have finally won out and lower prices are likely.
A Rising Wedge Pattern is usually a Bearish Reversal Pattern where the prior trend is an uptrend, but in rare cases it can also be a Bearish Continuation Pattern, where the prior trend is a downtrend, and then after consolidating in a rising wedge pattern, the prices can break down below support and continue in a downtrend.
Falling Wedge Pattern
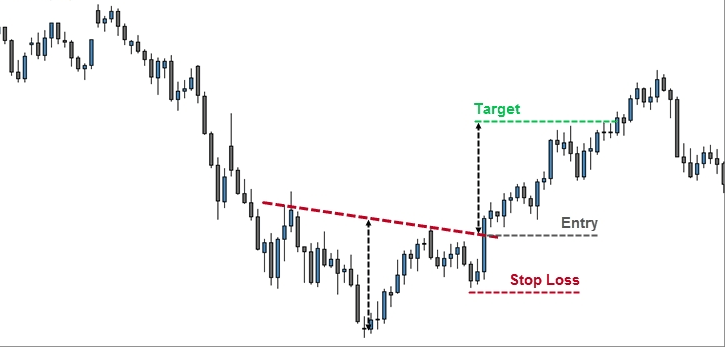
The Falling Wedge is a Bullish Reversal Pattern that starts wide at the top but contracts as the prices move lower. The price usually fluctuates between an upper downtrendline and a lower downtrendline, where the upper trendline acts as a resistance and the lower trendline acts as a support. It is usually formed over a period of 3-6 months. The prior trend before formation of this pattern is an downtrend, and a buy signal is given when the upper resistance is broken towards the end of the pattern. Like the rising wedge pattern, an increase in volume on the resistance break can also give a confirmation about the buy signal.
An example of a Falling Wedge Pattern is shown in the screenshot below.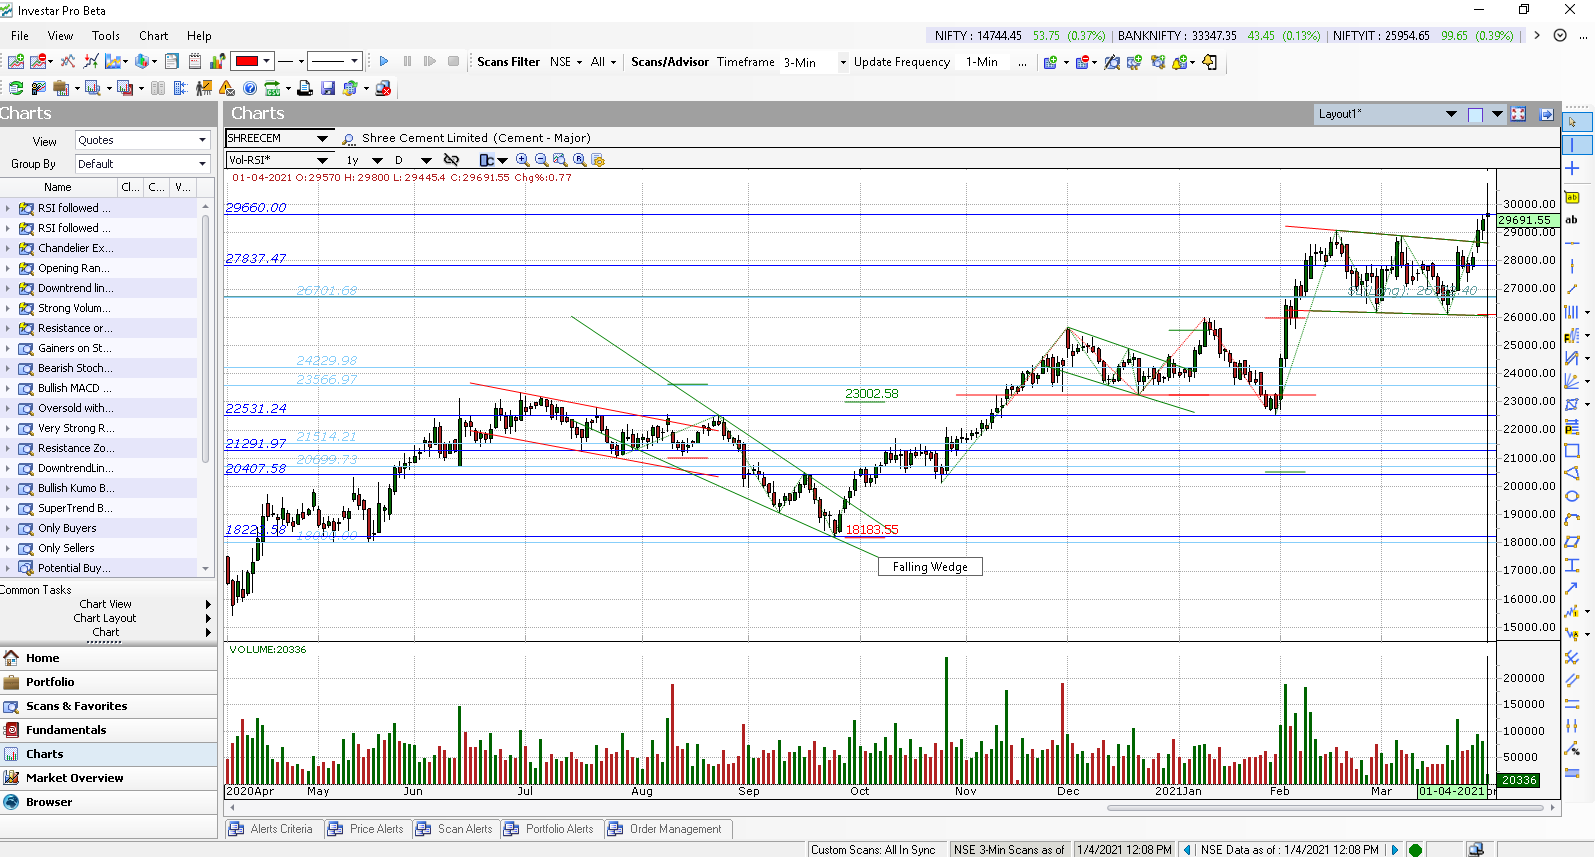
A Falling Wedge Pattern is usually a Bullish Reversal Pattern where the prior trend is a downtrend, but in rare cases it can also be a Bullish Continuation Pattern, where the prior trend is an uptrend, and then after consolidating in a falling wedge pattern, the prices can break out above resistance and continue in an uptrend.
For more details, check out our video on “Auto-Classical Patterns” for an in-depth look into this topic :