Bollinger Bands indicator
Bollinger Bands, a chart indicator invented by John Bollinger in the 1980s, are volatility bands set above and below a moving average.Bollinger Bands consist of: Bollinger Upper Band, Bollinger Lower Band and Bollinger Middle Band. Typical parameters are 20 and 2, respectively. The bands are set 2 standard deviations above and below the 20-day simple moving average. The default choice for the average is a simple moving average.
Bollinger Upper and Lower Bands measure deviations and Middle Band is a simple moving average.
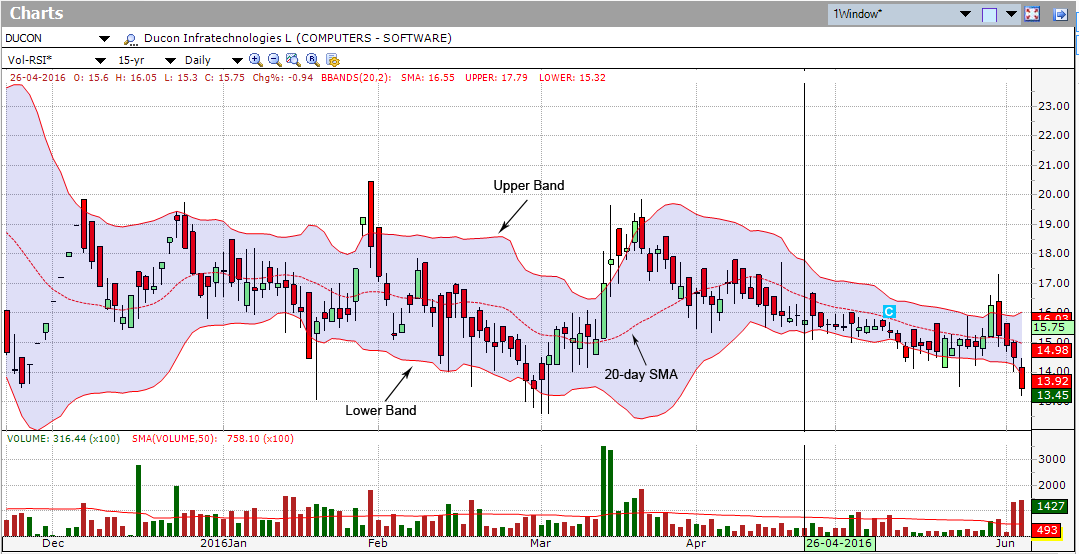
The upper band is the standard deviation plus the moving average, and the lower band is the moving average less the standard deviation.
How to use Bollinger Bands
Bollinger Bands basically tells us whether the market will become volatile (expansion) or will be bound into a tight trading pattern (contraction).
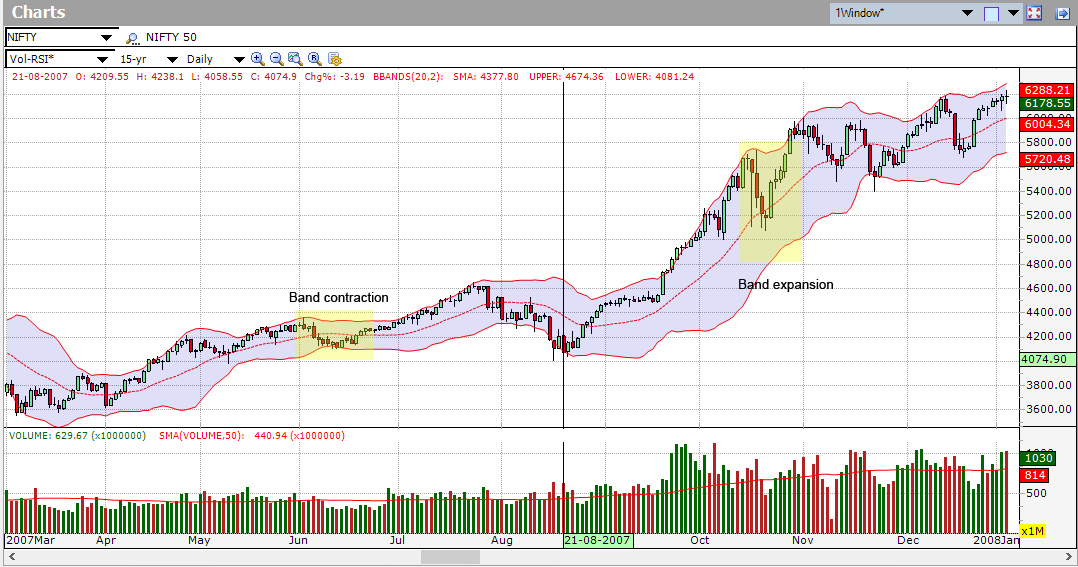
A Bollinger Band “squeeze” occurs when volatility falls to a relative low. This squeeze is often followed by periods of high volatility, and may bring about a noteworthy move by the stock to the upside or the downside.
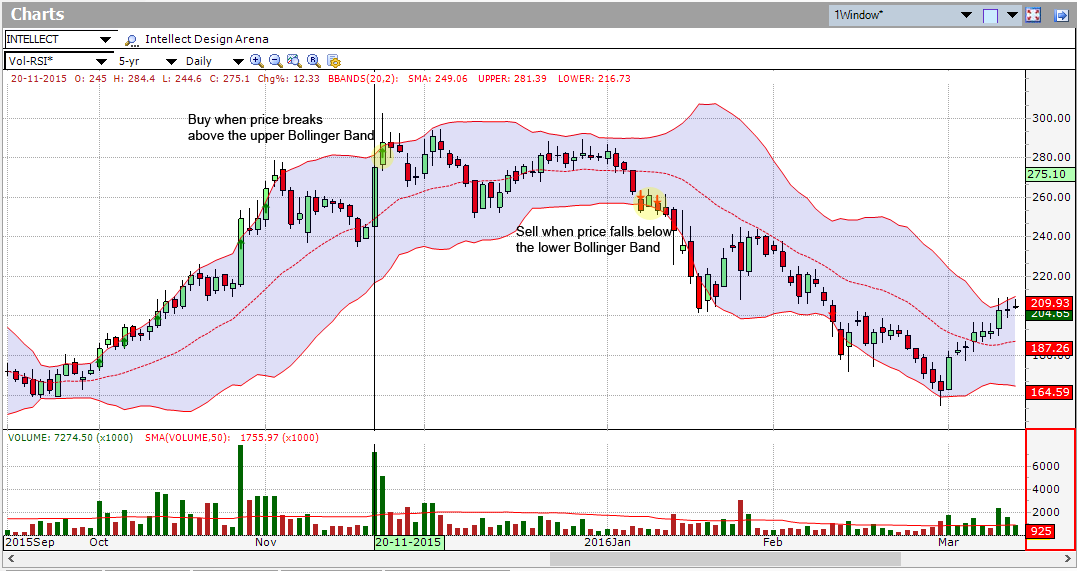
The use of Bollinger Bands varies widely among traders. Some traders buy when price touches the lower Bollinger Band and exit when price touches the moving average in the center of the bands. Other traders buy when price breaks above the upper Bollinger Band or sell when price falls below the lower Bollinger Band.
As other indicators, Bollinger Bands are not intended to be utilized as a stand-alone, you can combine Bollinger Bands with any other indicators like RSI, Auto- support and resistance, moving averages, MACD, stochastics, and any other technical analysis tool.