We are very excited to let you know that a new version of Investar Mobile for iOS v2.0 is now available! It has a totally re-vamped UI with many new features (already available in Android):
• Enhanced Charts with 35+ indicators
• Auto-Support/Resistance and Auto-Supply/Demand Zones
• Auto-Trendlines and Auto-Divergence (available with Auto-SRT Addon)
• Price/Scan Alerts
• Custom Scan Alerts (for users of Investar Pro)
• Watchlist Synchronization with Investar Desktop version. Scrip Detail View to analyse stocks in detail
• Market Overview along with existing features like NSE Cash/FO 1-min/5-min real time updates
So, how is the new version different and better than before? Read on to find out more…
Market Overview
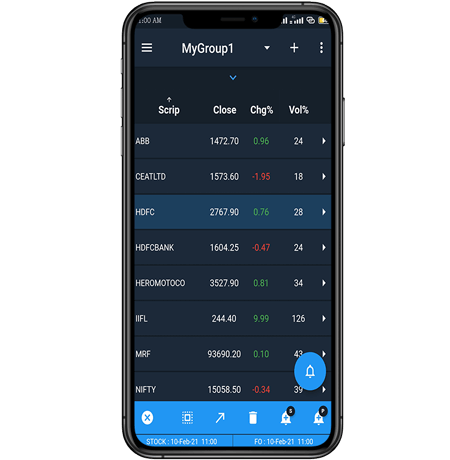
A quick market overview is now available by simply tapping the down arrow in the centre (as shown in the screenshot below). This gives the NIFTY and BANKNIFTY charts along with their current prices. Irrespective of the scrips present in your watch-list, you can get the overview of the market through Market Overview section.

Scan Alerts
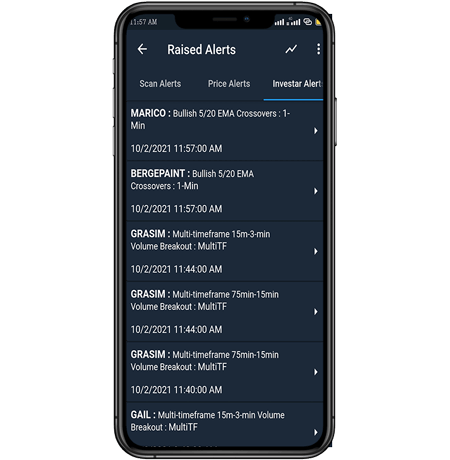
Now, you can set Scan Alerts on selected scrips or whole watch-list. Simply, long-press on any of the scrip in the watch-list, select all the scrips and then tap on Bell icon with an ‘S’ symbol. Add the Scan Alert Criteria by selecting Scan Alert Category ( like Technical Candlestick, Support/Resistance, Indicators, Risk/Reward and many more) followed by its time-frame (intraday, daily, weekly and monthly). It will give Scan Alert notifications as per the selected criteria. Tap on the app notification or go to Drawer Menu –> Show Raised Alerts or the Bell icon to view all the raised scan alerts.

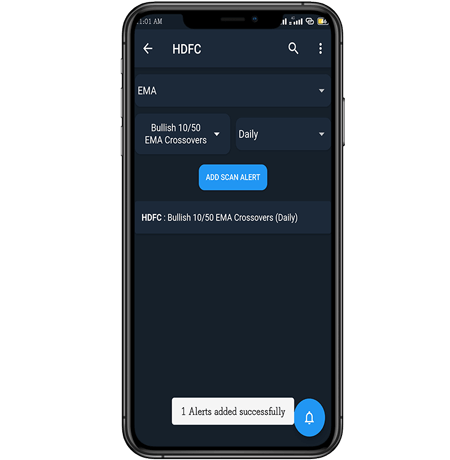
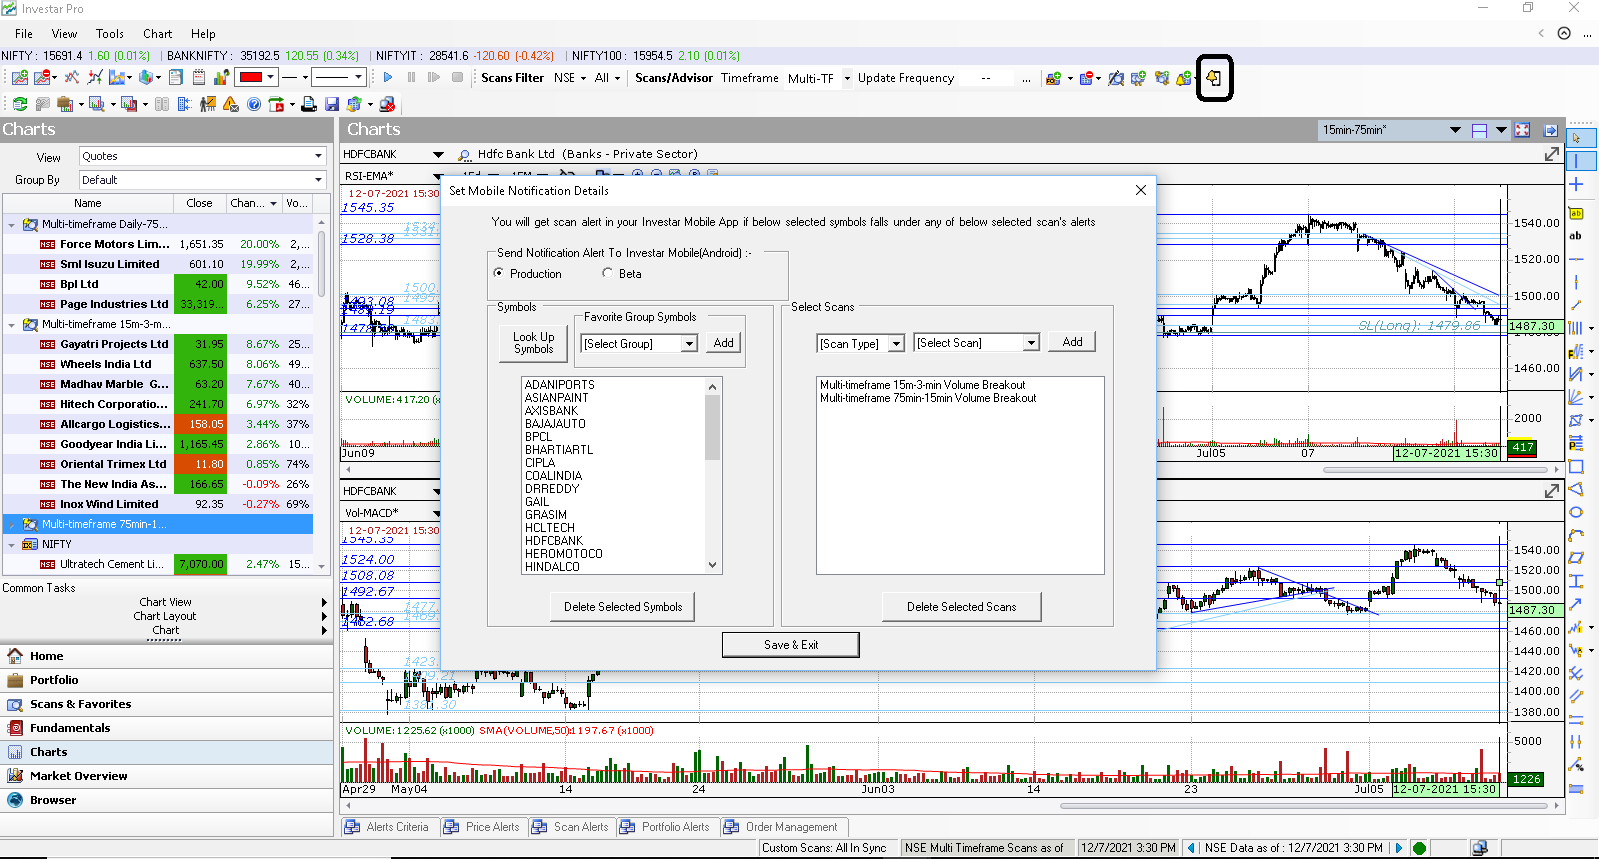
Custom Scan Alerts
Why restrict yourself to Pre-defined Scan Alerts only! With this latest iOS app version, you have an option to receive notifications to the mobile app for Custom Scan Alerts from Investar Desktop Edition (Production/Beta). This widely used feature works by a small configuration within your Investar Desktop Product. In the desktop version, simply create your Custom Scan Alerts and then tap on the mobile icon with a bell. Select the mobile app flavour on which you want to receive alerts followed by Custom Scan Alert selection. This is it. All the Custom Scan Alerts which you get on your desktop version will be available to your mobile.
Price Alerts
Similar to Scan Alerts, you can set Price Alerts. Simply long press on any scrip in the watch-list and tap on the Bell icon with a ‘P’ symbol. Select the price alert criteria and add it to the criteria list. It will display the Price alert notifications as an app notification.

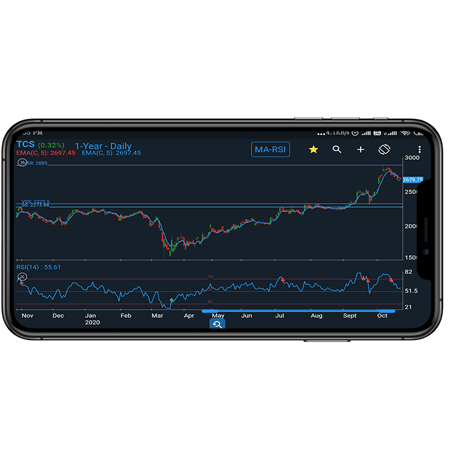
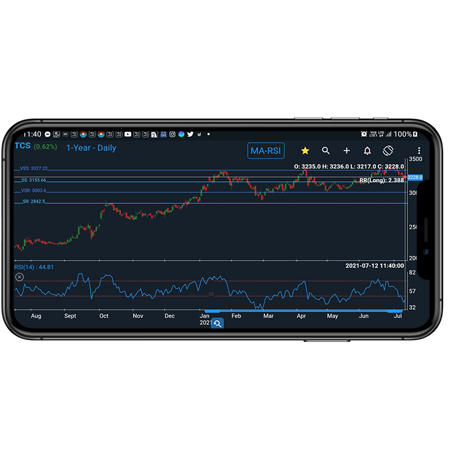
Auto-SRT (Support/Resistance/Trendlines/Divergence)
This is the most unique feature which is available with Investar Mobile and Desktop products only. Support/Resistance levels & Supply/Demand Zones, Trendlines, and Divergence are drawn automatically on visiting any chart using Artificial Intelligence. Risk/Reward ratio is also displayed on the chart.
Simply double-tap on Chart and tap on SRT icon to enable Auto S/R Levels, Auto S/R Zones, Auto-Trend Lines, Divergence or R/R ratio.

Need to find out how this can help you in finding volume breakouts and breakdowns? Simply Enable Auto SRT on Current Cursor, it will show Support/Resistance Levels, Zones, Divergence and Trendlines with respect to the current cursor (i.e. the levels that were seen exactly on the date where the current cursor is present). This is like visual back-testing, and can help you how this feature has worked in the past in order to fine-tune your strategy.
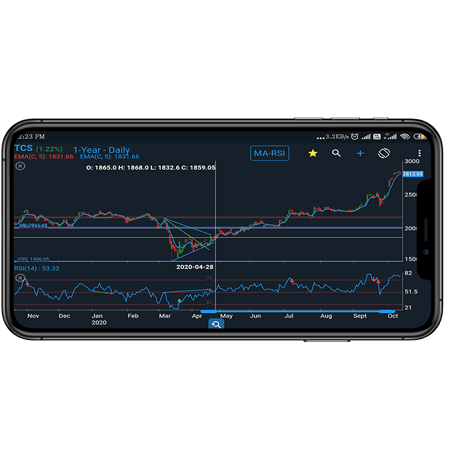
There are 4 default levels: VSS, VSR, SS, SR. VSS line shows Very Strong Support, in same way VSR shows Very Strong Resistance and SS and SR indicates Strong Support and Strong Resistance respectively.
Supply-Demand Zones (or Support-Resistance Zones or SR Zones for short) are areas of supply/demand created in the chart. Nearby Support/Resistance lines can be clubbed together to create a Support/Resistance zone. Using S/R zones instead of S/R lines can improve the accuracy of trading immensely as it can help you to avoid false buy/sell signals as well as give better targets and stop losses.
The Risk to Reward ratio is another metric that is key to successful trading. Investar App has the capability of not only drawing the support/resistance automatically using Artificial Intelligence, but also to calculate the Risk/Reward ratio based on that.
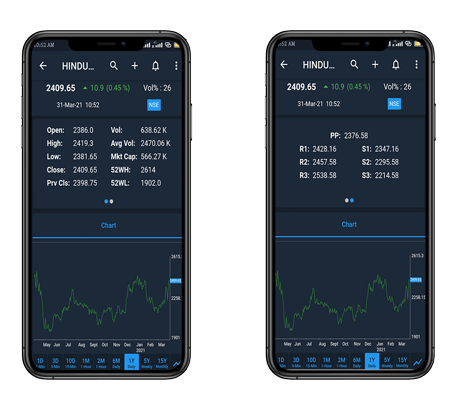
Scrip Detail View
When you select the ‘>’ at the right of a scrip in any watchlist, you will see a Scrip Detail view where you can see the important details about any stock and also the important Pivot Levels as show in the screenshot below:
Enhanced Scrip Code Lookup
The scrip code lookup is a lot more enhanced, especially for Futures and Options, and can be done anywhere from the Scrip Detail screen or also within the chart itself where you find the “Search” icon. If you select that and select “Options”, you will be able to quickly lookup all the Options. E.g., if you type “NIFTY 14850”, you will see all the NIFTY Call and Put options with 14850 strike price, as shown in the screenshot below:

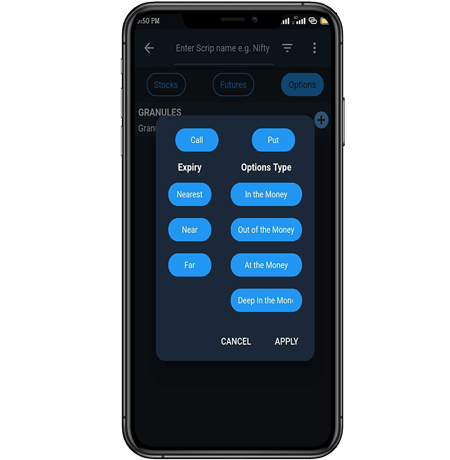
When you add an F&O scrip from the watchlist menu as shown below, you will see a more detailed list of all futures and options which can be filtered by call/put, expiry (nearest, near and far) and for options, whether they are “In the money”, “Out of the money”, “At the Money” or “Deep in the Money”, as shown in the screenshot below:
We can simply add one or more of the scrips after choosing these filters, and also remove from the list of scrips at any time, as shown below:

User-friendly discovery of new stock ideas
One of the USPs about the Investar Mobile app has always been how easy it makes it for traders and investors alike to discover new stock ideas. This version takes it one step further and makes it a breeze to add a stock to your watchlist. Now, you can easily swipe through stock charts of stocks appearing in a particular scan and add them to one or more watchlist(s).
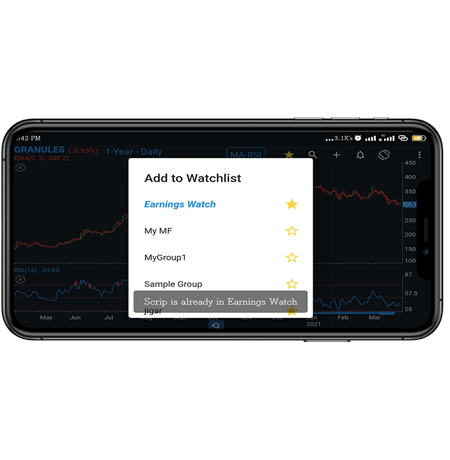
We’ve added a yellow “star” button on the top right of the chart, which gives a visual indication about whether a stock is already included in any of the watchlists.
If you select this while navigating a scan, then the stock can be added to a watchlist of your choice. An empty “star” indicates that the stock is not in any of your watchlists. A half-filled yellow “star” indicates that it is in one or more of your watchlists and a fully solid yellow “star” while navigating a watchlist indicates that it is part of a watchlist. At times, you will want to look-up a stock and see its chart and then add it to a watchlist. While adding to a watchlist also, you can choose any watchlist to add the stock easily (A star beside the watchlist name indicates whether it is already included in the watchlist or not). E.g. in the screenshot below, indicates that “GRANULES” scrip is already part of “Earnings Watch” but not in any other watchlists:
Once you’ve added stocks to a watchlist, you can swipe through charts of that watchlist on a daily basis to monitor your watchlists.
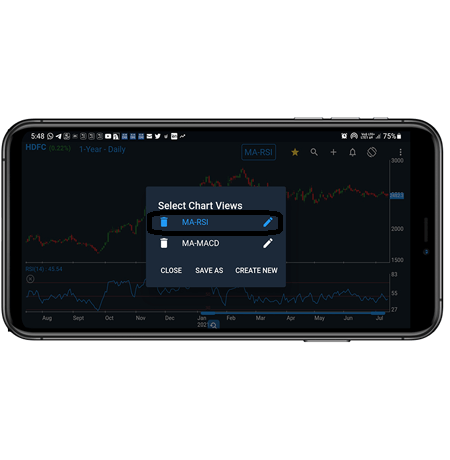
Chart Views (or Chart Templates)
Chart Views make it very easy to store the indicator settings in a template so that you can quickly switch to a different template if you like. To access the Chart Template to edit a Chart View or create a new one, you can long-press anywhere on the Chart or tap on the Char View name at the top.
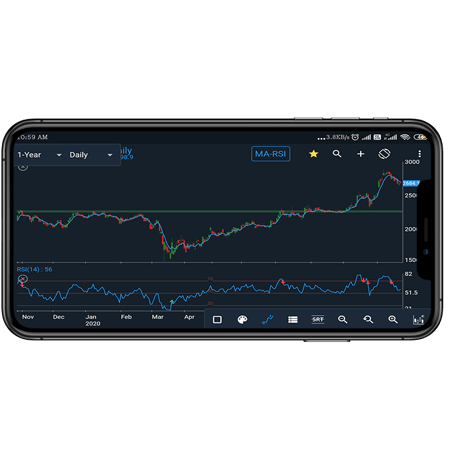
Greatly enhanced Indicator menus
With the new version, it becomes a lot easier to add an Indicator with the “Add Indicator” menu which can be accessed by long-pressing any part of the chart, as follows:

Once, you add an indicator say EMA, all the indicators for that Chart View can be added in the dialog without leaving it by keeping on selecting the ADD buttons, as shown in the screenshot below.

Once all the indicators are done adding, you can “ADD & CLOSE” for the final indicator to close the dialog and get all the indicators added at once. Earlier the same steps were very cumbersome and took a lot of back and forth between the chart and the indicator dialog.
