What is a Symmetrical Triangle?
A Symmetrical triangle is a Classical Pattern that occurs when a security’s price is consolidating in a way that generates two converging trendlines with similar slopes. If trendlines converge at different slopes they form a different chart pattern like a rising or falling wedge or an ascending or descending triangle.
How do you trade the Symmetrical Triangle Pattern?
Unlike some other classical patterns, a Symmetrical Triangle Pattern can be traded both ways, on a breakout as well as breakdown. A breakout from the upper trendline indicates the start of a new bullish trend while breakdown from the lower trendline marks the start of a new bearish trend.
The breakout or breakdown target for a symmetrical triangle is equal to the distance between the initial high and low applied to the breakout or breakdown point.
e.g. consider the symmetrical triangle detected by Investar software’s Auto-Classical Pattern feature as shown below.
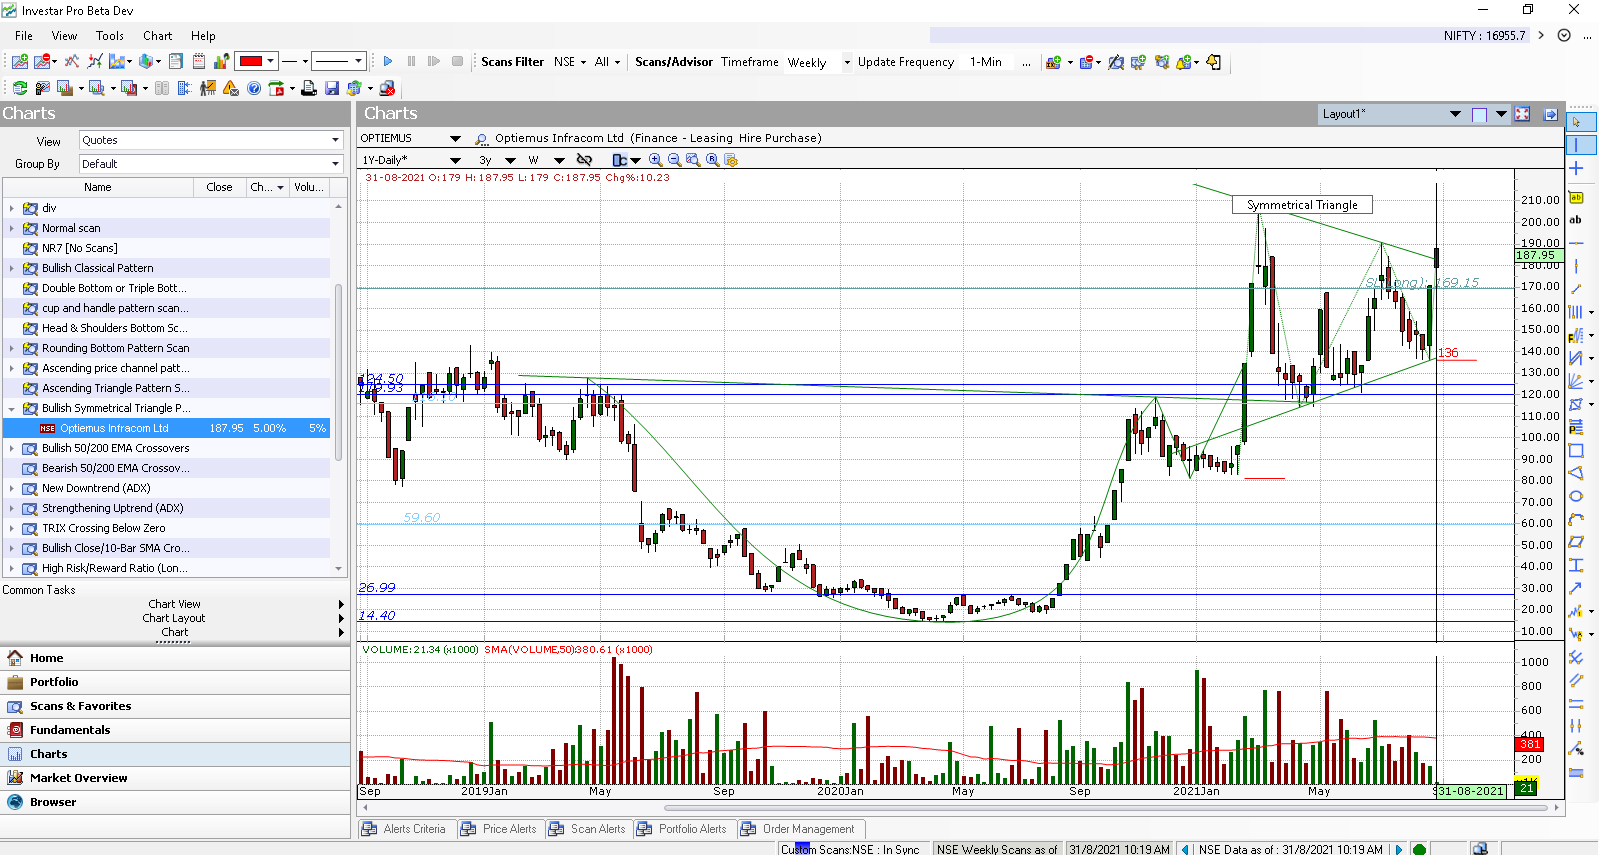
In this case, the symmetrical triangle pattern started at a low of 105 and moved up to 210 before the price range narrowed over time to form the symmetrical triangle. A breakout from 182 (as shown in the chart) would imply a price target of 182+(210-105) = 287. The Stop-Loss would be the lower trendline at 136 in this case since it is a breakout (Note: In case the stock broke down from the lower trendline, then the stop loss would be the upper trendline at 182 ).
You can scan for Symmetrical easily using our Auto-Classical Pattern scans as shown in the blog post here .
For more details, check out our video on “Auto-Classical Patterns” for an in-depth look into this topic :