Indicators signify a statistical method of technical analysis as opposed to a subjective approach. By looking at money flow, trends, volatility, and momentum, they provide a secondary measure to actual price movements and help traders confirm the quality of chart patterns or form their own buy or sell signals.
It is important to understand the different types of indicators before implementing technical indicators into your trading. Basically, there are two primary types of indicators:
Leading indicators are those who lead the price movement. They give a signal before a new trend or reversal occurs.
Lagging indicators are those who follow the price action. They give a signal after the trend or reversal has started.
Let’s get started and first understand what is a Lagging indicator.
What is a Lagging Indicator
Lagging indicators are typical “output” oriented. The importance of a lagging indicator is its ability to confirm that a pattern is occurring.
It is also a technical/trending indicator that trails the price action of an underlying asset, and traders use it to generate transaction signals or confirm the strength of a given trend. Lagging indicators confirm long-term trends, but they do not predict them.
Lagging indicators are generally drawn on the price chart itself and they work great in trending markets.
Examples of lagging indicators are Bollinger Bands, Moving Averages, Supertrend, etc. because they occur after a certain price move has already happened.
Lagging Indicator Example (Simple Moving Average)
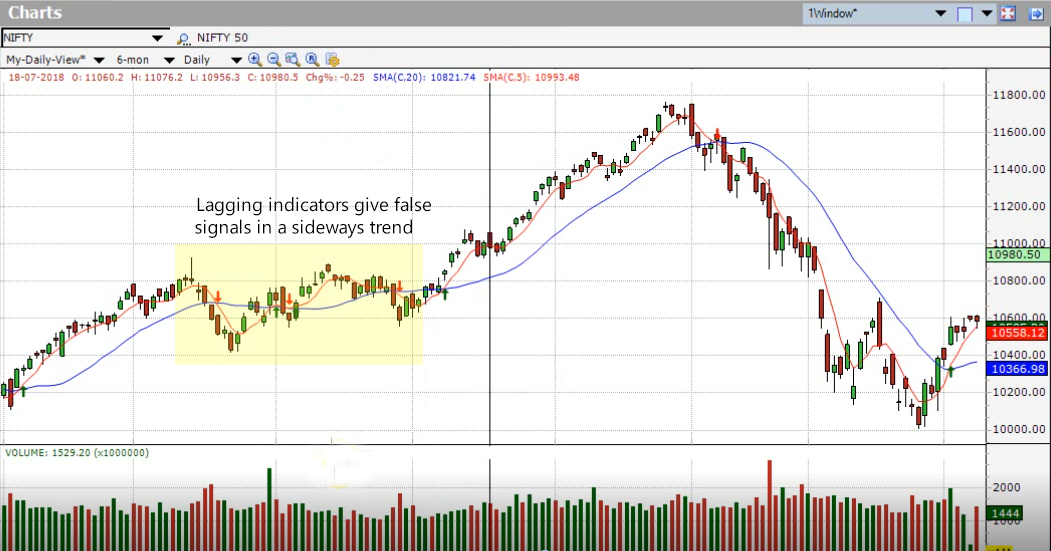
Trending indicators like SMA are called lagging indicators because the Buy/Sell signals they generate generally lag the price action, meaning that a change in trend in price shows up in the indicator a little later. A Simple Moving Average (SMA), as the name suggests, is a moving average of the Closing Prices.
As you can see in the chart below, when Nifty changed to a downward direction, it was captured by the 5-20 SMA Crossover a little later (as indicated by the sell signal), hence it is called lagging.
Buy/Sell Signals are generated in SMA when:
- Price crosses moving average
- Two moving averages cross each other.
E.g,(see the chart above) :
- 5-Day SMA crossing over 20-Day SMA generates a Buy Signal
- 5-Day SMA crossing below 20-Day SMA generates a Sell Signal
Not all these signals are correct, however, and Lagging Indicators like SMA give false signals in a sideways trend while they behave perfectly well in an uptrend and downtrend (see the chart above).
Note: Smaller parameters track the stock price more closely compared to the larger ones.
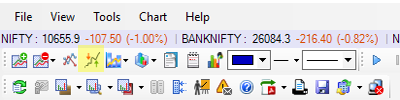
To configure the Buy/Sell signals all you have to do is Select Buy/Sell Signal from toolbar menu:
 A dialog box will be shown
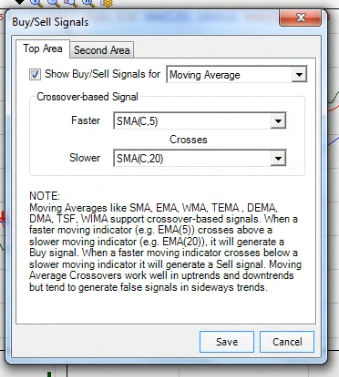
Simply select from the drop-down “Show Buy/Sell signals for the tab” and when you click on “Save” you can see buy sell signals in the chart
Check out our video on “Lagging Indicators – Types of Indicators – Part 1” for an in-depth look into this topic.
The thumb rule in any sort of ‘spread trade’ is to buy the cheaper asset and sell the expensive one. Thanks for sharing a great article.
I would prefer to go with a leading indicator because trader need to be alerted much before the trend is changing