Are you also confused about that three-lined indicator that shows the price range of your target stocks? Do you want to understand what they tell about the market condition?
Let’s clear your dilemma and understand the concept of the Bollinger band.
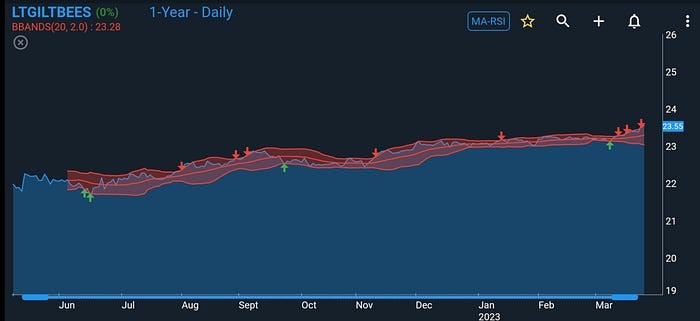
Yes, that three-lined indicator is called a Bollinger band.
Bollinger’s band is an analytical indicator that helps in measuring the volatility of financial instruments. This concept was first introduced by John Bollinger in 1983. This works as an indicator that comprises three lines or commonly known as bands.
The middle band indicates the simple moving average of the instrument’s price (default for the period of 20 days). The remaining two bands the upper band and the lower band are two standard deviations above and lower than the middle band. They depict the range of volatility of the price based on the standard deviation (the default value is 2). This standard deviation shows the difference between the upper and lower bands.
When the distance contracts, it indicates low volatility and when the distance expands it indicates high volatility. This combination of three bands indicates whether the prices are relatively higher or lower.
Let’s learn 5 trade strategies with Bollinger band which will improve our trade understanding.
1. Bollinger squeeze
It is the situation that occurs when the bands contract. This depicts low volatility and can indicate a major breakout either an advance or decline in the prices in near future.
The breakout after the squeeze can be in either direction, an upside break is bullish while a downside break is bearish.
However, the narrow bands don’t give any signal to buy or sell stocks but simply depicts a possible directional move in the future
2. RSI strategy
The Bollinger band indicator has a limitation where it doesn’t let you know the strength of the band movement.
In this case, Relative Strength Index(RSI) plays a huge part. It lets the trader know the momentum by comparing the number of days the security closes up versus closes down. And it is displayed between the range of 0 to 100.
An RSI value above 70 indicates overbought security
And below 30 indicates oversold security.
When the market makes a higher high but RSI indicates a lower high, then it’s a sign of weakness and is called bearish divergence. On the contrary, if the market depicts a lower low but the RSI shows a higher low, it’s a sign of strength and is called a bullish divergence.
Facing issues in choosing the best strategy for your trading requirements?
Here’s the solution:
Investar’s Technical Analysis software can assist you with all your trading requirements.
Its technical charts provides auto buy and sell signals, along with auto-updating custom scans which can be defined in a easy to use UI.
In addition, Investar gives you the option to choose Auto Support/Resistance and custom frameworks and groupings.
3. Reversal strategy
Bollinger bands depict that 95% of the price will be fluctuating within the bands. So think about these bands as elastic bands which will come to their original position if stretched too far. Thus the position of the bands can help us predict if the market condition is going to be reversed.
But to understand it better and take the decision on time, other techniques like support/resistance and candlestick patterns need to be taken into consideration.
4. Trade within the band
After a steep upward or downward movement in price, Bollinger bands will flatten and there is a high probability that at least several back-and-forth movements between the upper and lower bands will occur.
When bands are parallel there is a high chance that the price will stay within the bands.
Thus, when there aren’t clear trends and direction it’s wise to buy when the price is near to lower band and sell when the prices are near the upper band.
This strategy will usually work well in sideways trends.
5. Moving average strategy
The Bollinger band moving average strategy is simple to implement.
If the price crosses above the middle line (moving average) it gives the buy signal, because it depicts the uptrend. It’s wise to exit the market if the price crosses below the moving average.
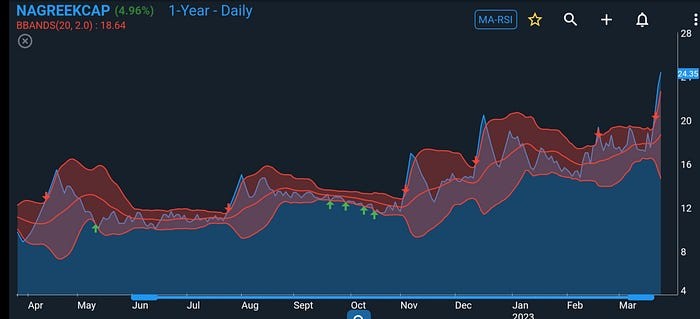
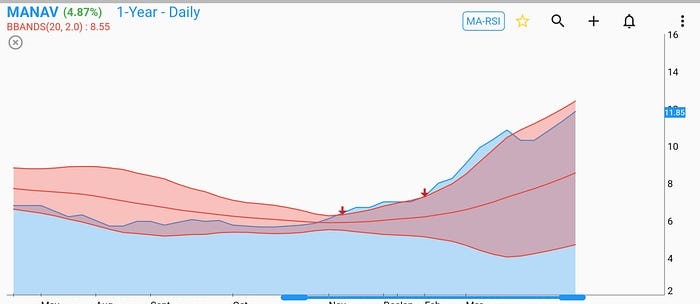
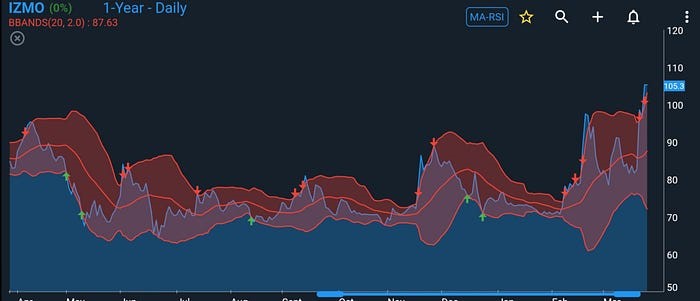
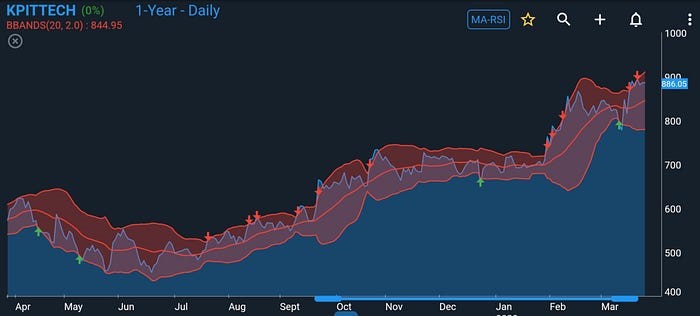
You can see different stocks in same chart view and same Bollinger Band settings using Investar’s Chart Layout.
Enjoy the benefits of getting solutions for all your trading requirements with Investar Technical Analysis Software.
The above-mentioned strategies are a few of the best ones. However, they are not the absolute solutions, you can curate and decide which will work for you the best.
It’s a common strategy that has been given by all free software. What is your special strategy that is important.
You can use Auto Support/Resistance feature in software that plots the Support/Resistance automatically like an expert Technical Analyst, and gives you additional edge in your trading.
Thank you for sharing this informative article! As a professional trader, I’ve often encountered the Bollinger Bands indicator but wasn’t fully aware of its concept and implications. Your explanation has provided clarity on how these bands represent volatility and price range based on standard deviation. The five trading strategies you’ve discussed, like the Bollinger Squeeze and Moving Average strategies, offer valuable insights into utilising this indicator effectively. I appreciate the recommendation of Investar’s Technical Analysis software, which seems like a comprehensive solution for traders. Overall, your article has enhanced my understanding of Bollinger Bands and inspired me to incorporate these strategies into my trading approach.
Thanks
Thomas Knecht
KQ Markets
Glad you found it useful! Thanks for leaving feedback, it really encourages us to do more blogs.
If you don’t know about bollinger bands you’re not a professional trader. Sorry.
I prefer the SS/resitance