We are pleased to announce a new release of Investar (Version 6.3), now available with Classical Patterns in charts and custom scans (with the Auto-Classical Patterns addon) and many other features/bug fixes:
- Auto-Classical Patterns in Charts and Custom Scans
- Improved Scan Alert functionality with bug-fixes.
- Improved Multi-timeframe Scan Alerts.
- More user-friendly IQL with better auto-suggestions.
- And many more…
Auto-Classical Patterns
At InvestarIndia, we always keep adding new features to enhance your trading experience with our software. Classical Chart Patterns are one of the most powerful tools for any Technical Analyst. However, it can take years of experience to master the art of drawing Classical Patterns on a chart. The new version of Investar makes this a breeze by automatically detecting the Classical Chart Patterns of your choice simply by visiting a chart. Not only that, but you can also get the Target and Stop/Loss for each pattern, so that you can clearly see where you need to enter and exit the trade to maintain the optimal Risk/Reward ratio.
To enable Classical Patterns, simply right-click on the chart and select “Auto Classical Patterns->Enable Auto Classical Patterns”:

Once enabled, the Investar Software automatically detects the following Classical Patterns on visiting a chart:
- Cup and Handle / Inverse Cup and Handle
- Rounding Top/Bottom
- Head and Shoulders Top/Bottom
- Double Top/Bottom
- Triple Top/Bottom
- Flag/Penant
- Rising/Falling Wedge
- Ascending/Descending Triangle
- Symmetrical Triangle
- Price Channel
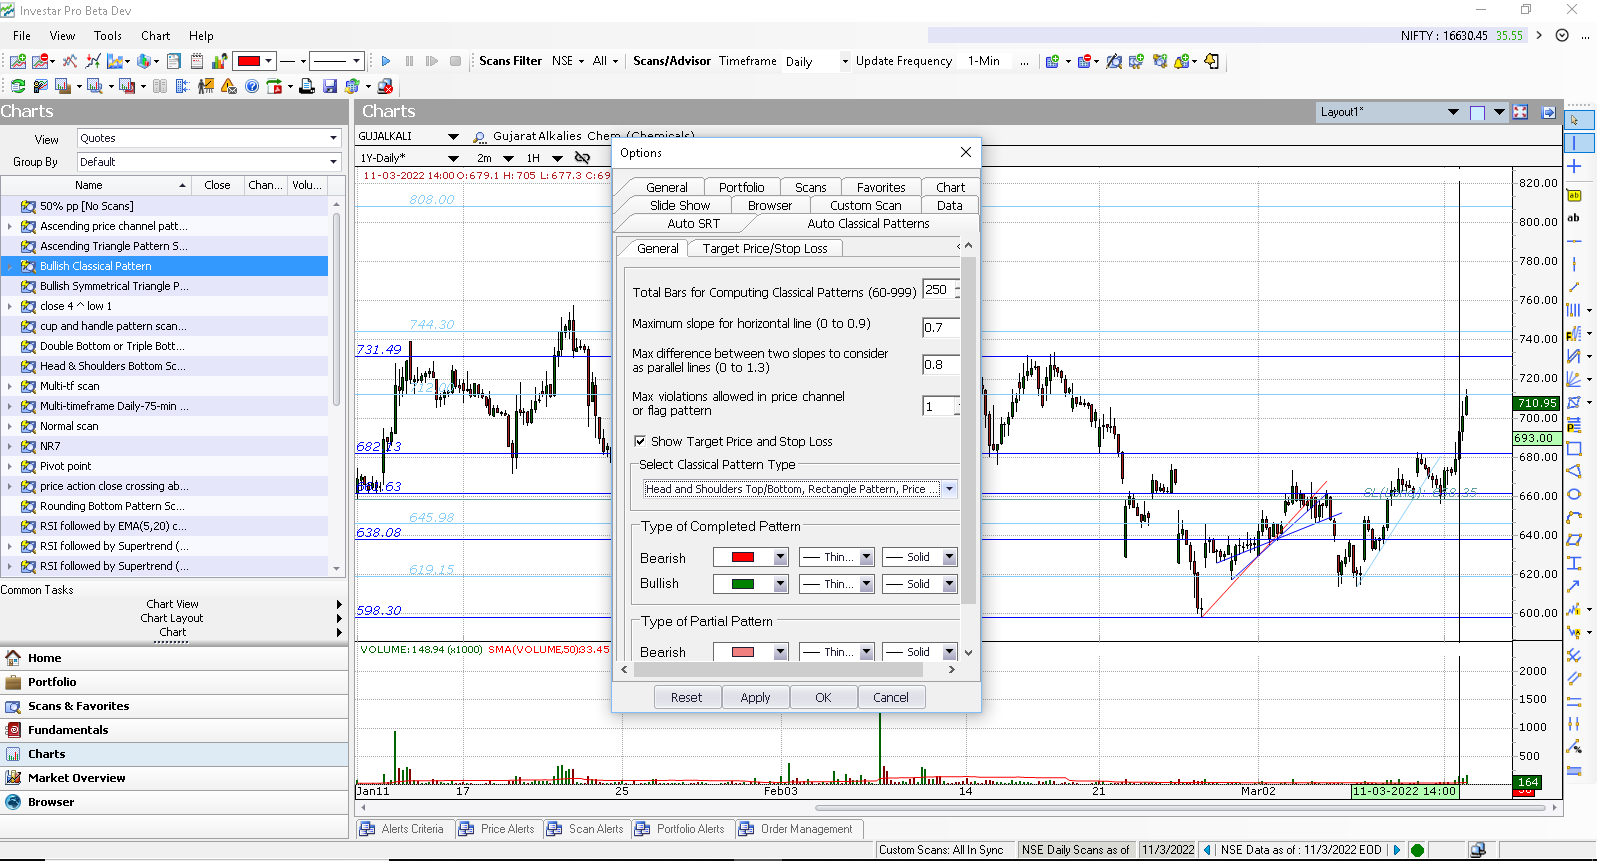
Also, make sure that the Classical Pattern that you want to see is selected in the “Tools->Options->Auto Classical Patterns->General” tab as shown below:
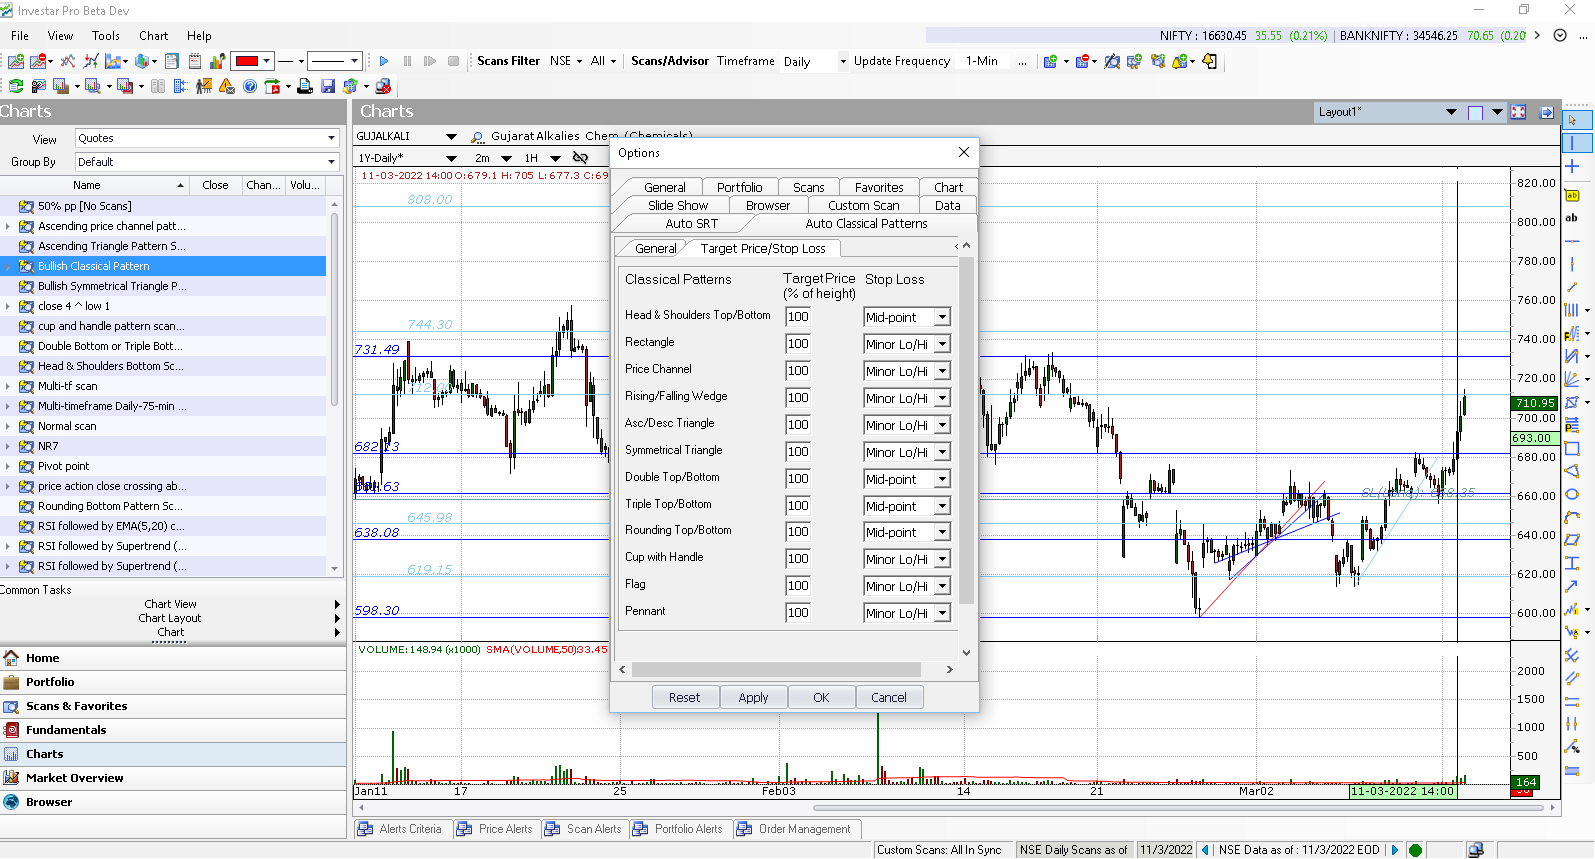
Typically, the target price on a Classical Pattern breakout/breakdown is usually the height of the pattern. You can however configure this to be lesser than the height and also configure the Stop/Loss for each Pattern differently for each Pattern as shown below:
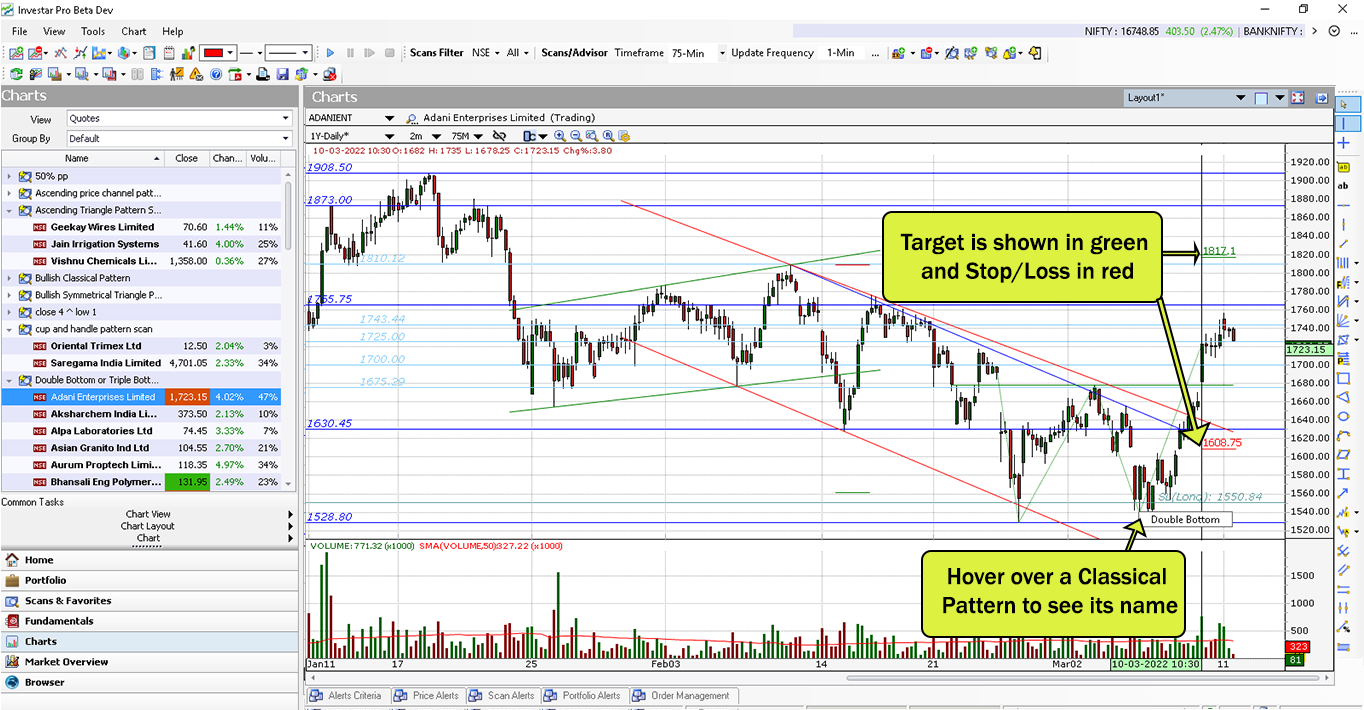
Once configured, the Target Price and Stop Loss will be displayed along with the Classical Pattern as shown below:
Auto-Classical Pattern Scans
What if you wanted to know which stock is breaking out/breaking down out of a Classical Pattern? It is not possible to go through each and every stock in 2000+ stocks in NSE to see if it is breaking out of a Classical Pattern formation. The Auto-Classical Pattern Scans feature makes this a breeze.
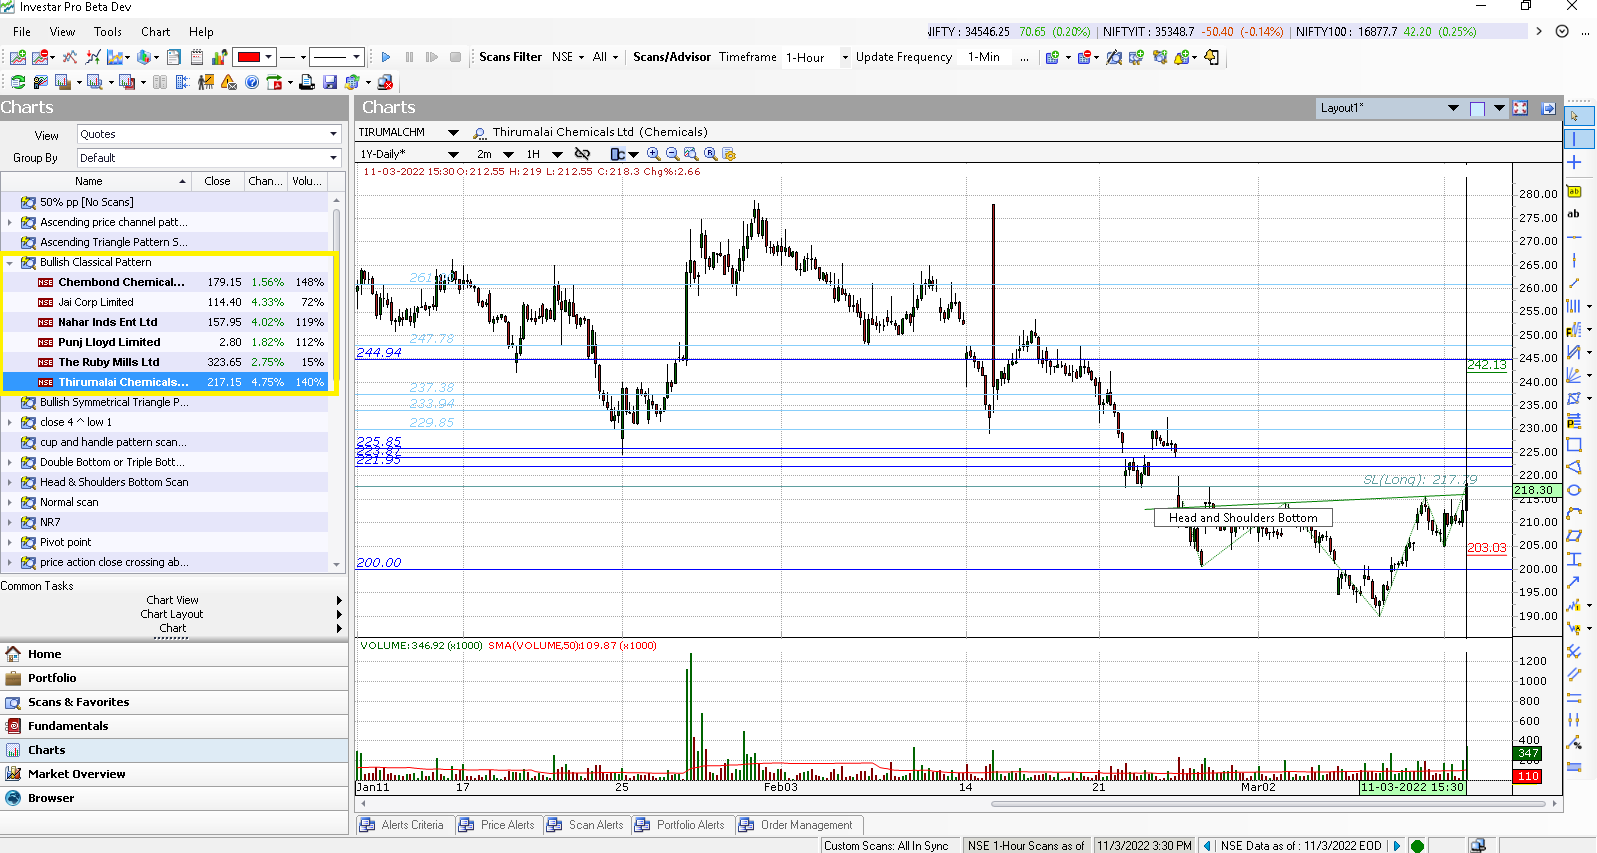
You can create a simple Auto-Classical Pattern Scan to find stocks breaking out of any Bullish Classical Pattern as shown below:

And the scan results will be automatically displayed as below based on the timeframe selected in “Scans/Advisor Timeframe”. When you click on a stock, you can see the pattern displayed on the chart along with its Target and Stop Loss. E.g. Triumalai Chemicals is showing a Bullish Head and Shoulders Bottom breakout in an hourly timeframe.